Fig. 12
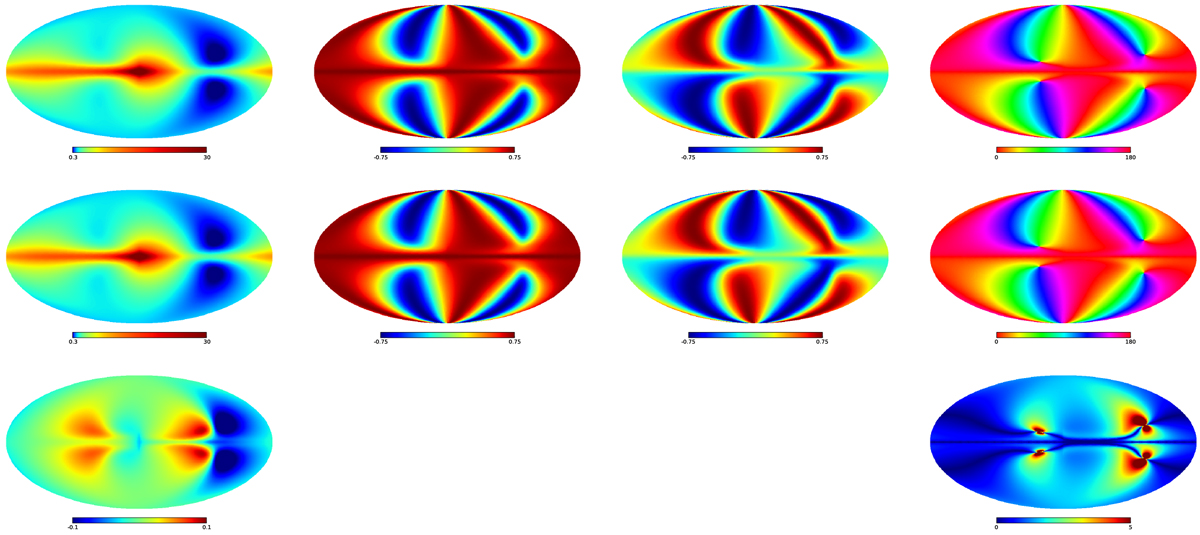
Maps of the synchrotron emission. Columns correspond to the maps of I, q, u, and polarization position angles (in the IAU convention). The first row correspond to synchrotron emission when the original GMF model is adopted. For the second row, the adopted GMF corresponds to the best-fit obtained from the analysis of dust maps, case B in Sect. 5. In the third row, we present the relative difference of the intensity maps ((Iin − Î)∕(Iin + Î)). For the polarization angles, we display the acute angles between the polarization vectors.
Current usage metrics show cumulative count of Article Views (full-text article views including HTML views, PDF and ePub downloads, according to the available data) and Abstracts Views on Vision4Press platform.
Data correspond to usage on the plateform after 2015. The current usage metrics is available 48-96 hours after online publication and is updated daily on week days.
Initial download of the metrics may take a while.