Fig. 11
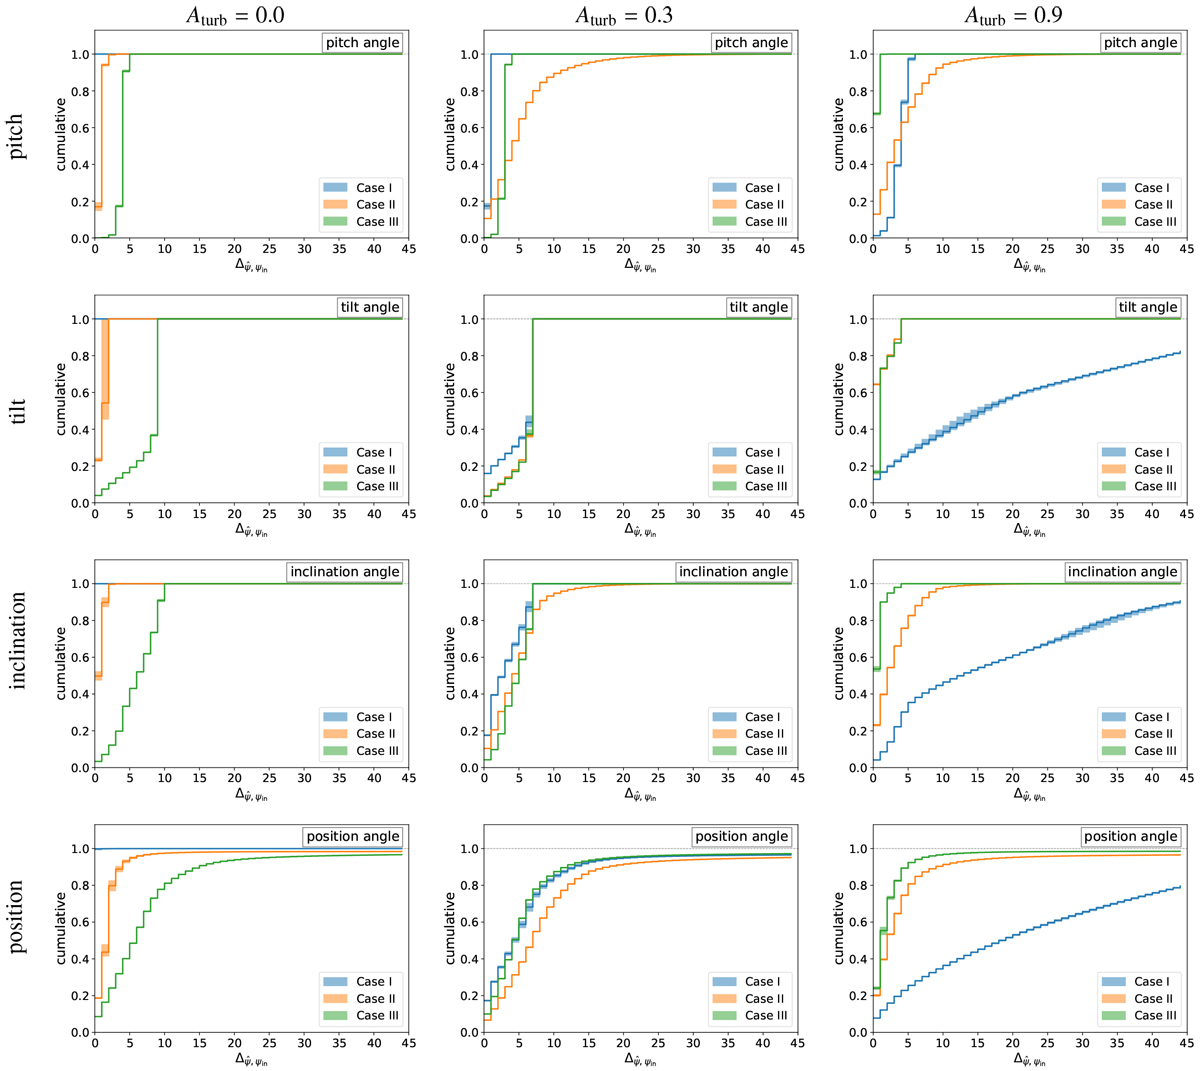
Cumulative distributions the difference angles between the regular GMF model in simulations S2-turb and the best-fit reconstructed models using the MCMC likelihood analysis. From top to bottom for the pitch angles, the tilt angles, the inclination angles, and the position angles. The three reconstruction cases corresponds to different models assumed to model the data: case I: nd ≡ ARM4 and gmf ≡ LSA (both models underlying the data); case II: nd ≡ ED and gmf ≡ LSA; and case III: nd ≡ ED and gmf ≡ ASS. From left to right, the columns correspond to Aturb = 0.00, Aturb = 0.30, and Aturb = 0.90. The shaded area corresponds to the 68% CL extracted from the posterior of the probability distribution as sampled from the MCMC analysis.
Current usage metrics show cumulative count of Article Views (full-text article views including HTML views, PDF and ePub downloads, according to the available data) and Abstracts Views on Vision4Press platform.
Data correspond to usage on the plateform after 2015. The current usage metrics is available 48-96 hours after online publication and is updated daily on week days.
Initial download of the metrics may take a while.