Fig. 10
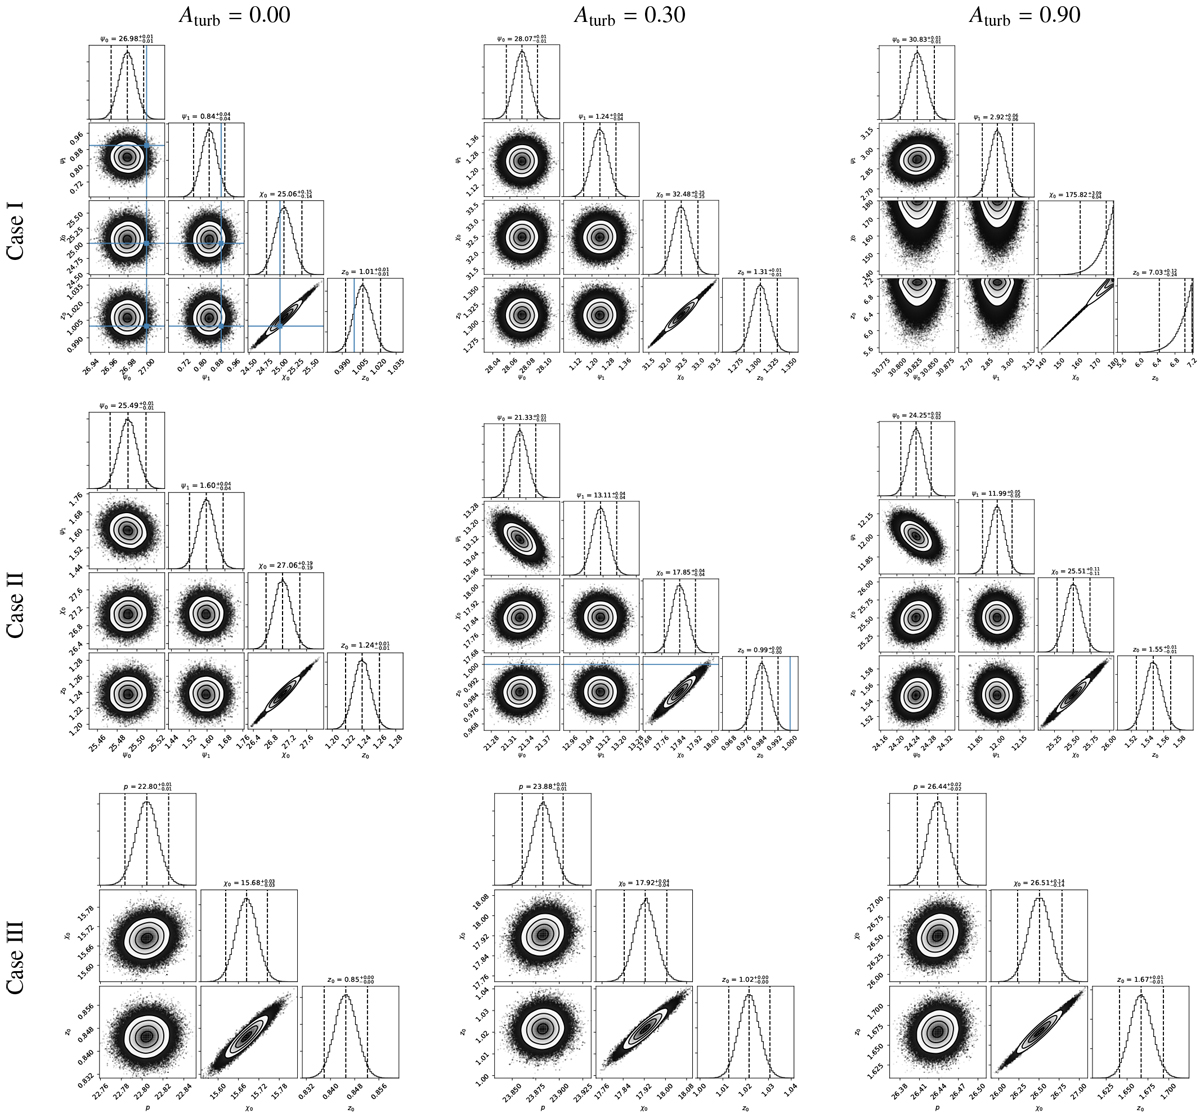
Corner plots of the 1D and 2D marginalized posterior distributions of the regular GMF parameter for the three reconstruction cases discussed in Sect. 6.2 applied to the S2-turb simulations. Angles are given in degree and the scale heights in kpc. From left to right: columns correspond to Aturb = 0.0, Aturb = 0.3 and Aturb = 0.9, respectively. From top to bottom for cases I to III defined as: case I: nd ≡ ARM4 and gmf ≡ LSA (both models underlying the data); case II: nd ≡ ED and gmf ≡ LSA; and case III: nd ≡ ED and gmf ≡ ASS. The vertical and horizontal light-blue lines mark input parameter values.
Current usage metrics show cumulative count of Article Views (full-text article views including HTML views, PDF and ePub downloads, according to the available data) and Abstracts Views on Vision4Press platform.
Data correspond to usage on the plateform after 2015. The current usage metrics is available 48-96 hours after online publication and is updated daily on week days.
Initial download of the metrics may take a while.