Fig. 5.
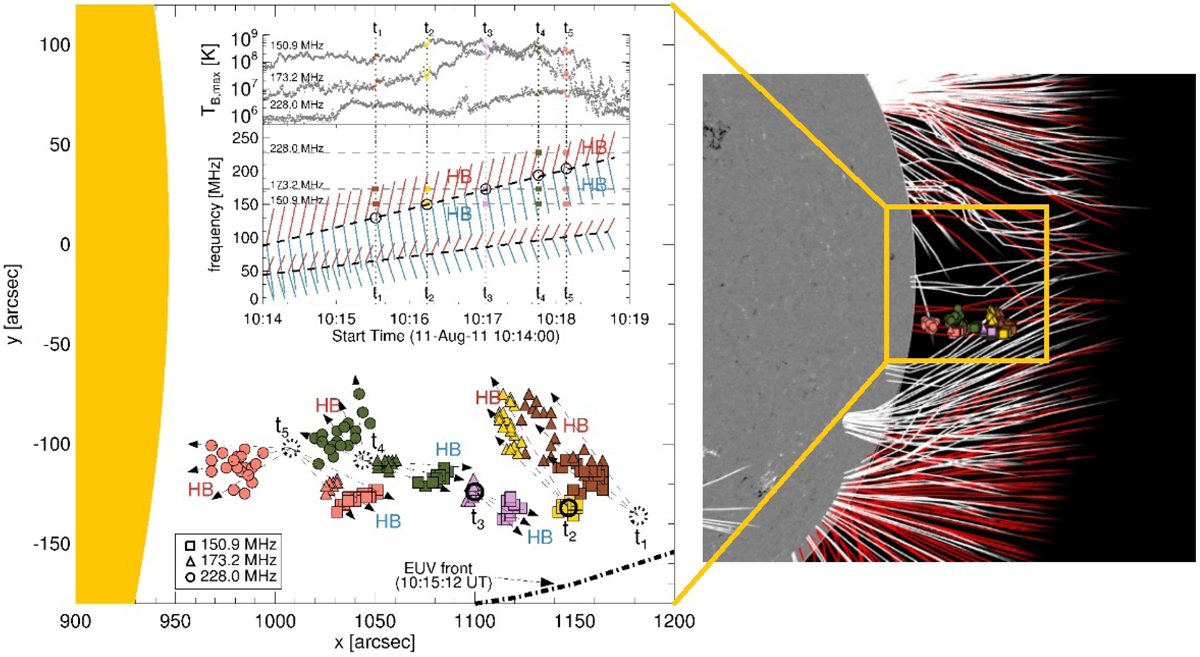
Left panel: spatiotemporal evolution of the BB + HB emission at 150.9, 173.2, and 228.0 MHz. Different symbols and colors specify, respectively, the frequencies and times tk at which the HBs were observed. HBs have been imaged at the H frequency: Only the position of the maximum temperature brightness (TB, max) is depicted. Solid circles at times t2 and t3 indicate the observed positions of the BB emission; dotted circles at times t1, t4, and t5 denote inferred positions of the BB emission on the basis of the observed HB emissions. Dashed arrows departing from solid and dotted circles identify the directions of the electron beams producing the observed HB emission at each time tk. The bottom panel of the inset shows a simplified overview of the observed HB structure in the time interval 10:14−10:19 UT, while the upper panel shows the maximum TB at each frequency. Right panel: coronal magnetic field reconstructed with the PFSS technique up to 1.25 R⊙. White lines correspond to closed magnetic field loops, red lines to open fields. The observed radio sources are aligned along open field lines. The plot was obtained with the JHelioviewer tool (Müller et al. 2017).
Current usage metrics show cumulative count of Article Views (full-text article views including HTML views, PDF and ePub downloads, according to the available data) and Abstracts Views on Vision4Press platform.
Data correspond to usage on the plateform after 2015. The current usage metrics is available 48-96 hours after online publication and is updated daily on week days.
Initial download of the metrics may take a while.