Fig. 4.
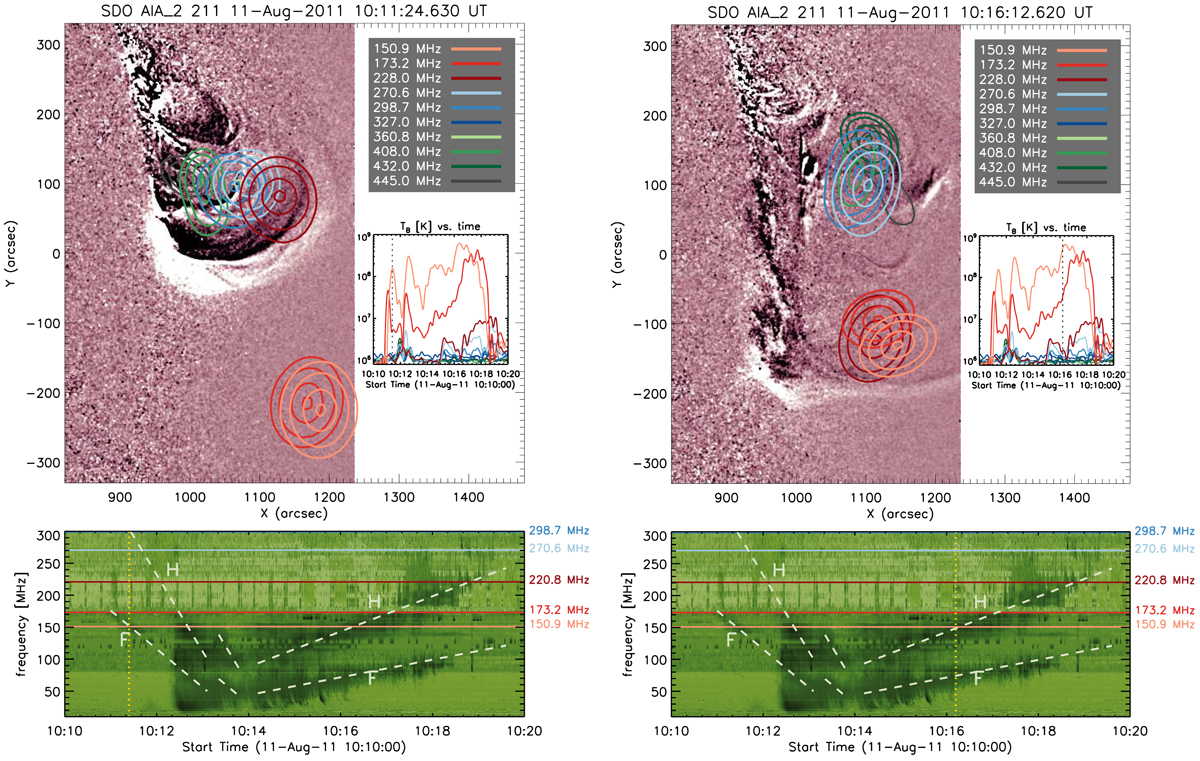
Contour plots of the locations of the type II radio emission with respect to the eruption as seen by simultaneous images taken by AIA in the 211 Å channels. Contour levels represent 95%, 97%, 99%, and 99.9% of the maximum temperature brightness of the full NRH radio map. The positively drifting type II emission (left panel) seen at frequencies of 150.9 and 173.2 MHz at the F was emitted around 10:11.5 UT and is clearly well ahead of the CME eruption. Right panel: position of the negatively drifting type II emission at a later time. The simultaneous radio emissions at frequencies higher than 200 MHz are not related to the shock but are rather attributable to hot prominence material expanding during the eruption.
Current usage metrics show cumulative count of Article Views (full-text article views including HTML views, PDF and ePub downloads, according to the available data) and Abstracts Views on Vision4Press platform.
Data correspond to usage on the plateform after 2015. The current usage metrics is available 48-96 hours after online publication and is updated daily on week days.
Initial download of the metrics may take a while.