Fig. 4
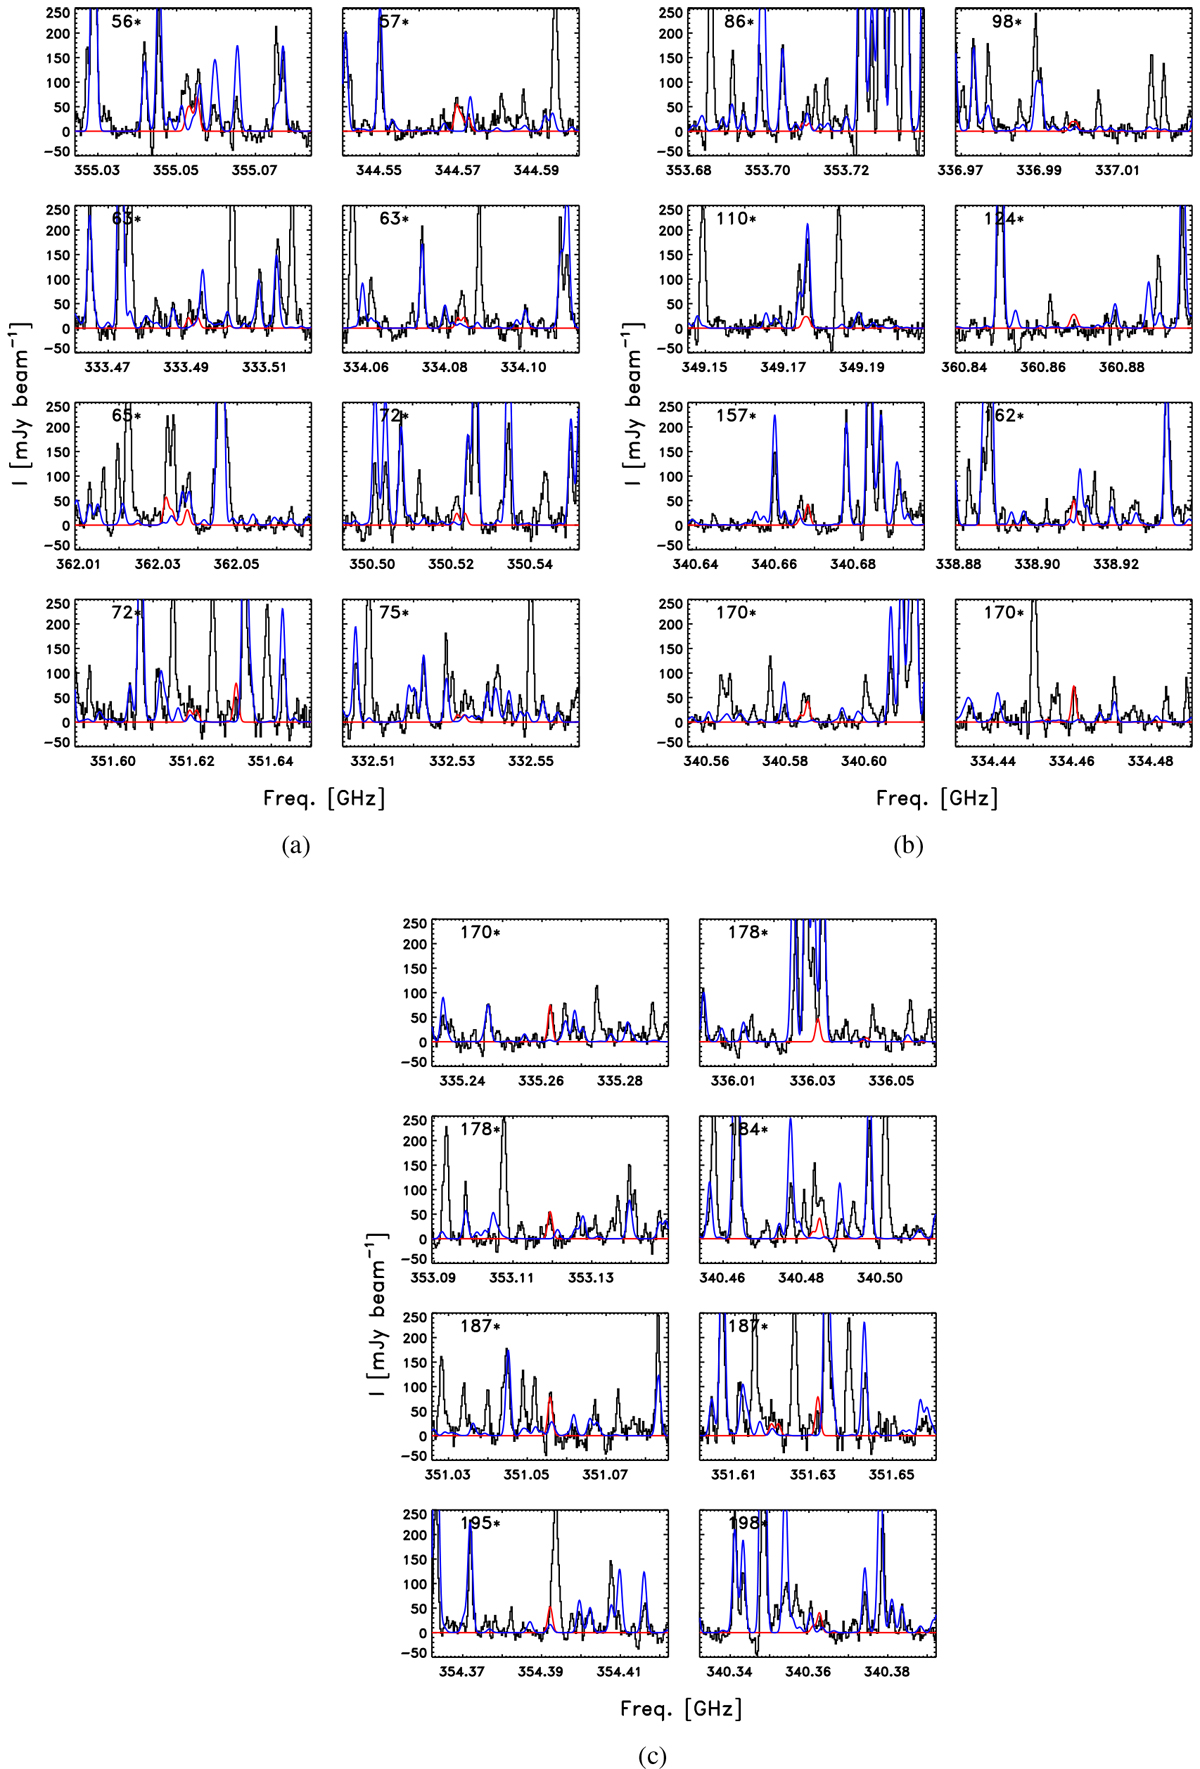
Spectra for the 24 transitions of the symmetric conformer of CH3OCHD2 predicted to be the strongest given the derived excitation temperature and column density. In the panels, the red line shows the fit to the CH3OCHD2 transition while the blue lines show the predictions for of all other species identified as part of the PILS survey (see, e.g., Drozdovskaya et al. 2019; Manigand et al. 2020, and references therein).
Current usage metrics show cumulative count of Article Views (full-text article views including HTML views, PDF and ePub downloads, according to the available data) and Abstracts Views on Vision4Press platform.
Data correspond to usage on the plateform after 2015. The current usage metrics is available 48-96 hours after online publication and is updated daily on week days.
Initial download of the metrics may take a while.