Fig. A.2.
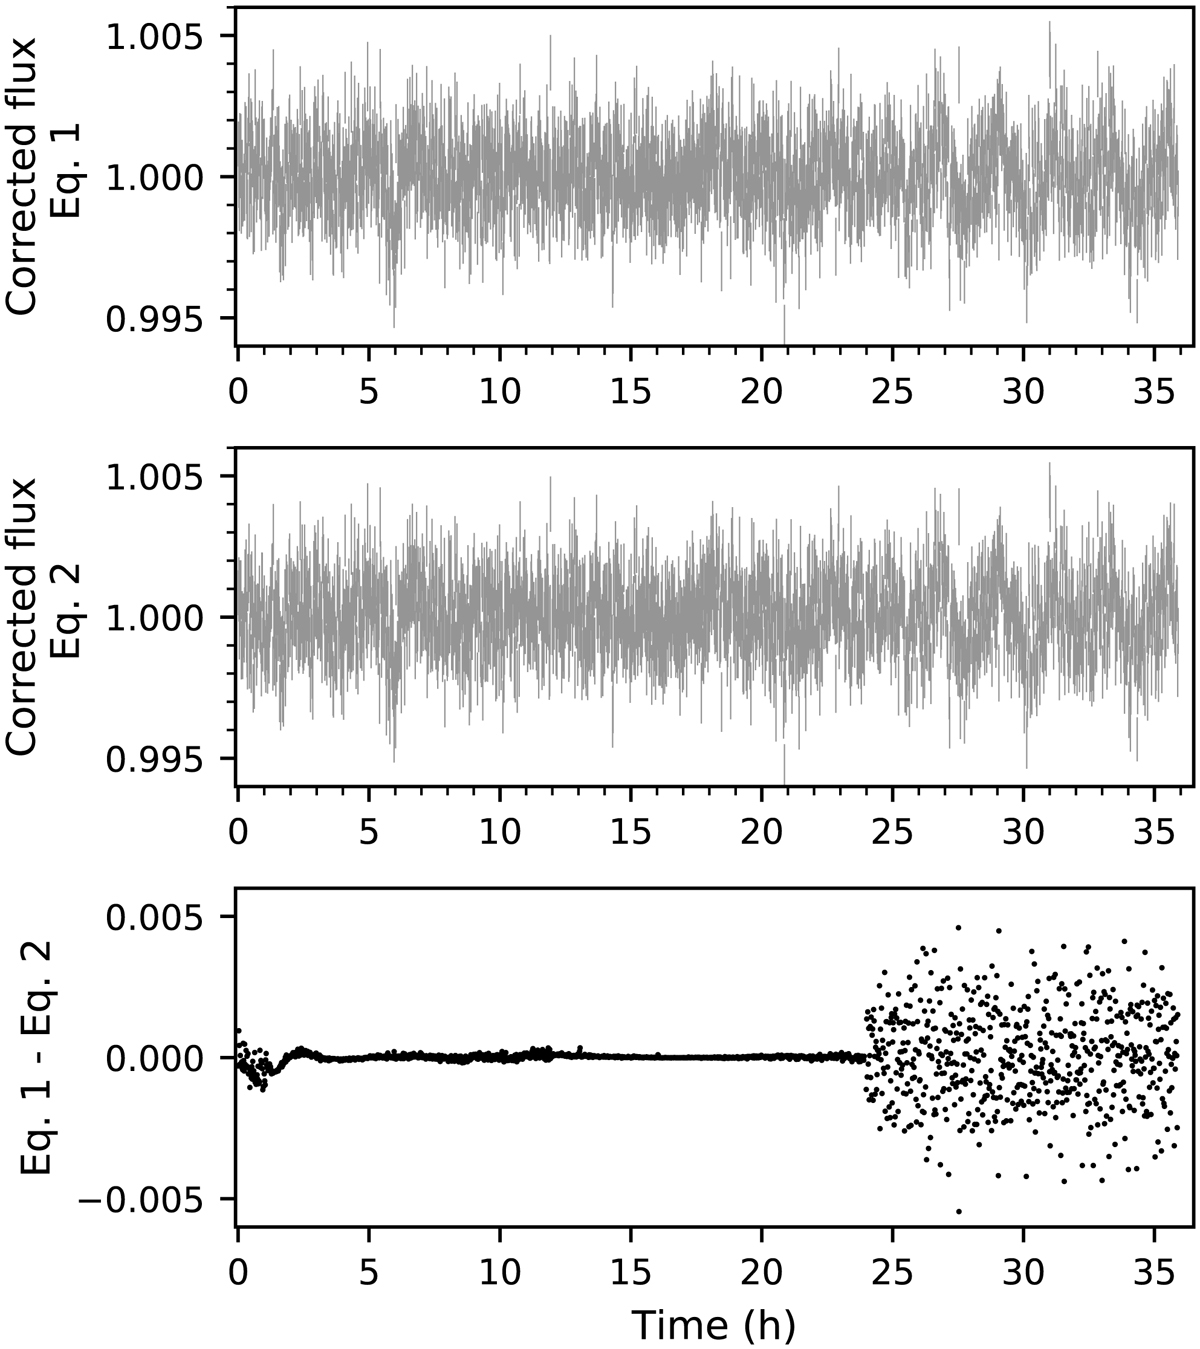
Comparison of the Spitzer pixel-phase-corrected flux using Eqs. (1) (top) and (2) (middle). Data have been averaged every 32 images (≈1 min) and normalized. Vertical bars stand for the standard deviation of each one-minute bin. Both solutions seem rather alike, even though the BIC comparison favors Eq. (2). Bottom panel: difference of the corrected data shown in the top and middle panels. The first ≈24 h of data do not show a significant modulation, so the amplitude of the periodic signal in Eq. (2) tends to zero, and so Eqs. (2) ≈ (1).
Current usage metrics show cumulative count of Article Views (full-text article views including HTML views, PDF and ePub downloads, according to the available data) and Abstracts Views on Vision4Press platform.
Data correspond to usage on the plateform after 2015. The current usage metrics is available 48-96 hours after online publication and is updated daily on week days.
Initial download of the metrics may take a while.