Fig. 5.
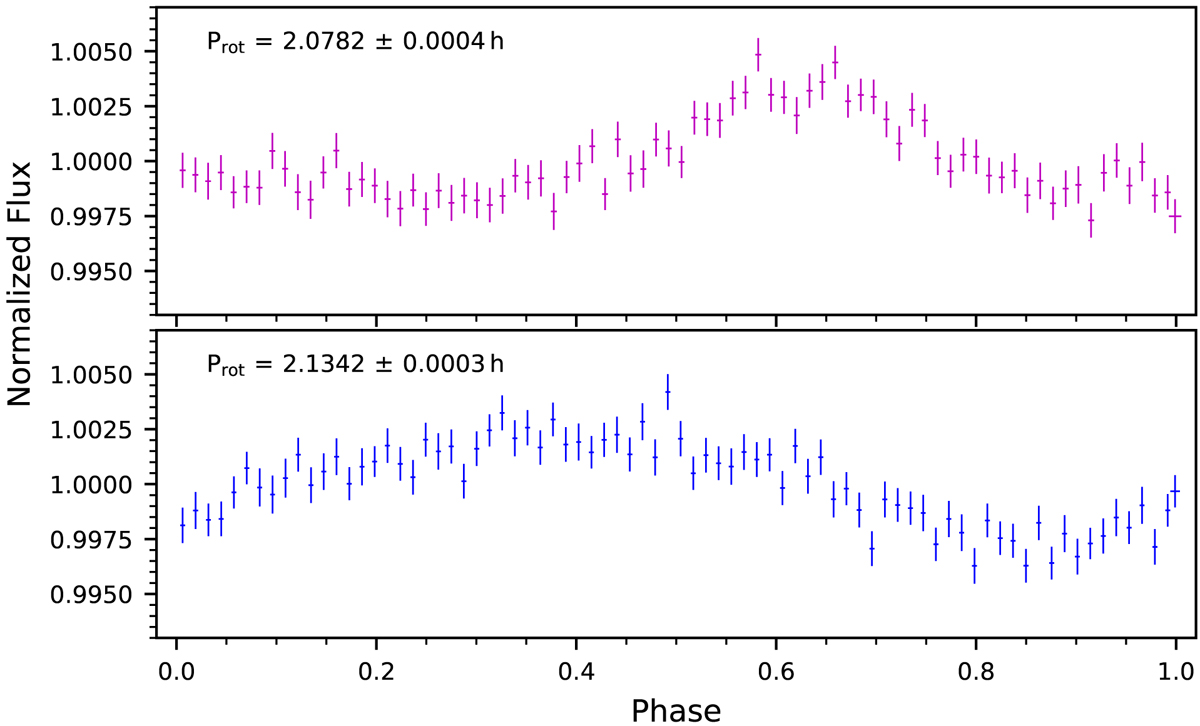
Individual rotation-modulated signals of VHS J1256-1257A and B, shown in the top and bottom panels, respectively. Each individual signal was computed by removing, from the TESS data, the best fits for the rotation of the other component and the correlated noise. Data for each signal (referred to the same zero time) were phase-folded with their periods and binned every 200 points. Vertical bars indicate the standard deviation of the data in each bin divided by ![]() . Horizontal bars indicate the uncertainty in phase. This was estimated using error propagation and the individual phase uncertainty of the data, computed as
. Horizontal bars indicate the uncertainty in phase. This was estimated using error propagation and the individual phase uncertainty of the data, computed as ![]() .
.
Current usage metrics show cumulative count of Article Views (full-text article views including HTML views, PDF and ePub downloads, according to the available data) and Abstracts Views on Vision4Press platform.
Data correspond to usage on the plateform after 2015. The current usage metrics is available 48-96 hours after online publication and is updated daily on week days.
Initial download of the metrics may take a while.