Fig. 2.
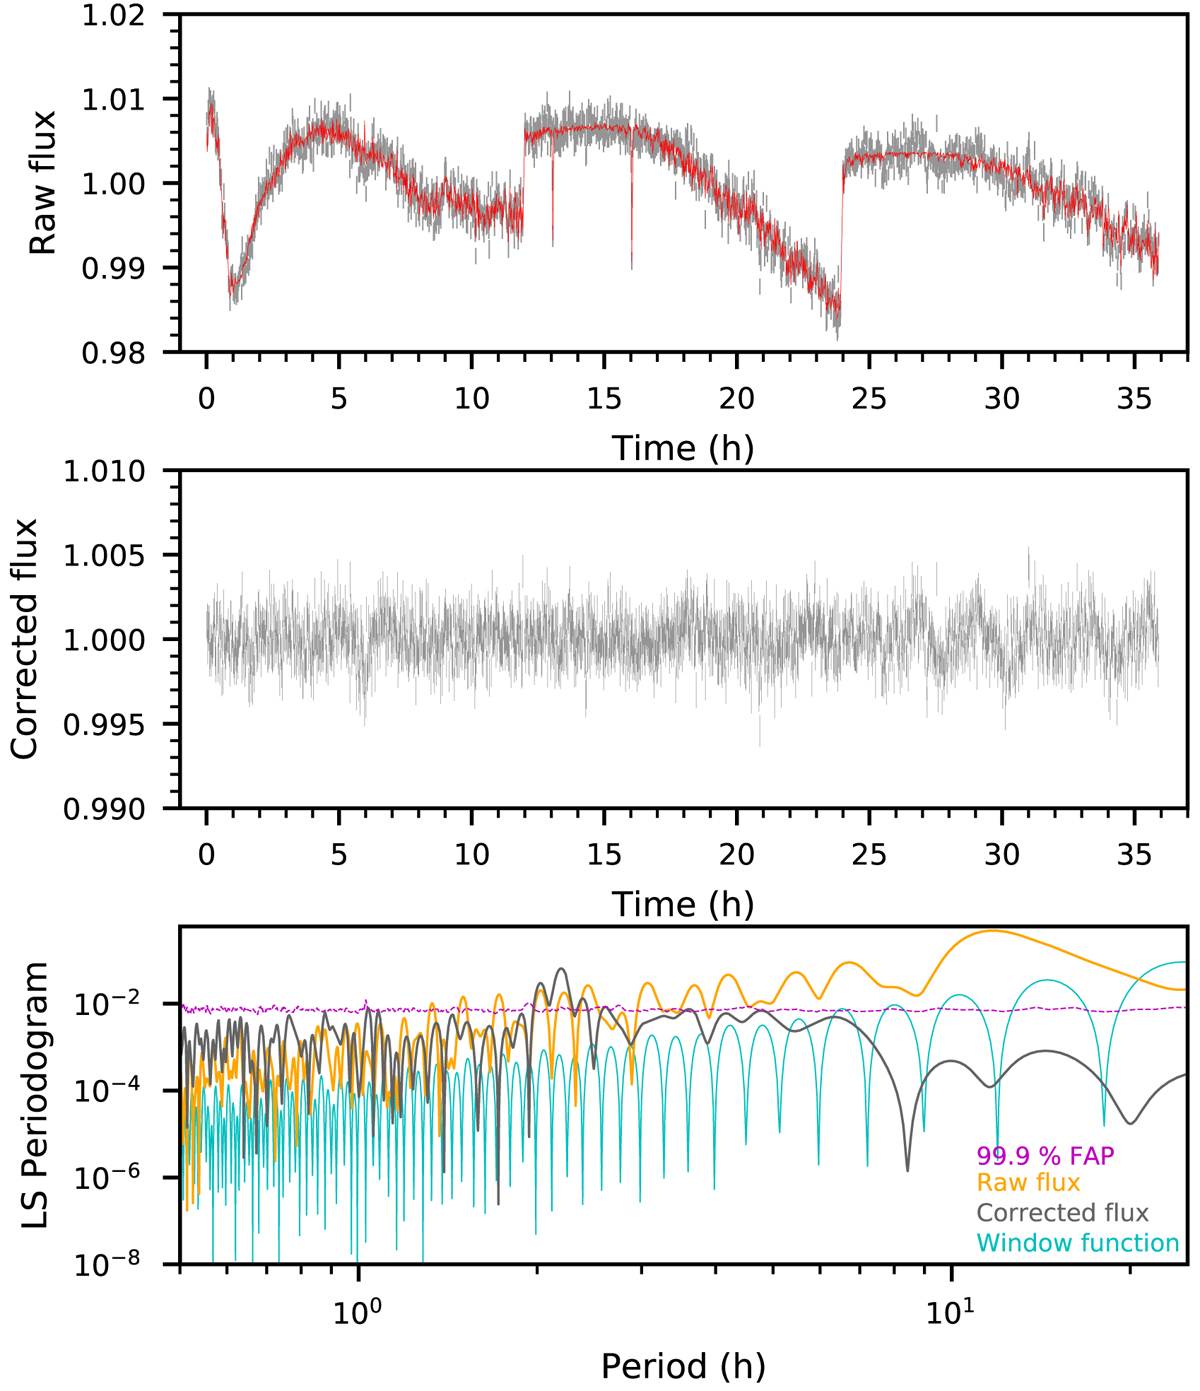
Analysis of the infrared data. Top: Spitzer raw normalized flux of VHS J1256-1257AB as a function of time. The pixel phase model is over-plotted with a red curve. Data are in bins of 32 consecutive two-second images (∼1 min). Vertical bars indicate the standard deviation of the data in each bin, with a median value of 0.1%. The zero time corresponds to MJD 58801.26092. Middle: pixel-phase-corrected photometry as a function of time. Bottom: LS periodogram for the raw and corrected photometry in orange and gray, respectively. The window function (cyan) and the 99.9% FAP (magenta) are also shown. The pixel-phase-corrected flux also shows a significant peak around ∼2.1 h.
Current usage metrics show cumulative count of Article Views (full-text article views including HTML views, PDF and ePub downloads, according to the available data) and Abstracts Views on Vision4Press platform.
Data correspond to usage on the plateform after 2015. The current usage metrics is available 48-96 hours after online publication and is updated daily on week days.
Initial download of the metrics may take a while.