Fig. 1.
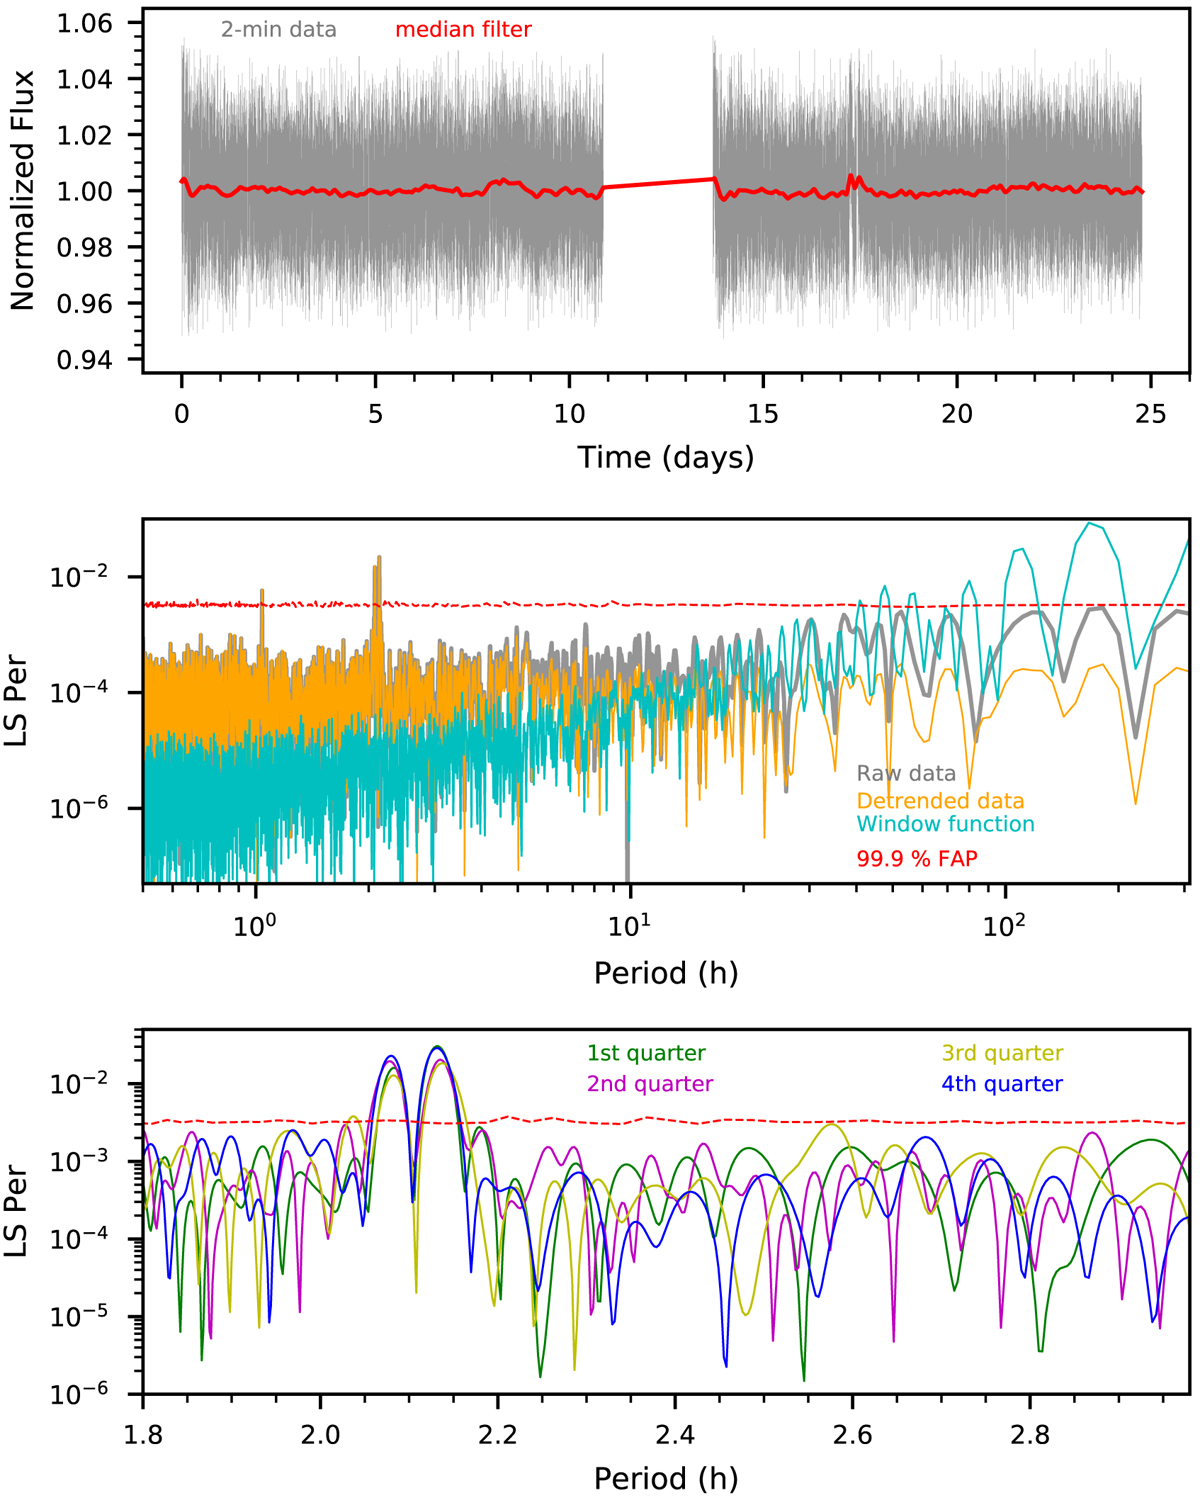
Analysis of the optical data. Top: TESS light curve of VHS J1256-1257AB. Vertical lines denote individual uncertainties, and the red line is a 601-point median filter. The zero time corresponds to MJD 58568.93734. Middle: LS periodogram for the TESS light curve shown in the top panel (gray curve) and after detrending with a median filter (orange). The window function is also shown (cyan). We computed the associated 99.9% FAP (red) from 10 000 light curves generated by data randomization. Bottom: LS periodogram for different chunks of the data. A double peak centered at ∼2.1 h is present in all the sections of the data.
Current usage metrics show cumulative count of Article Views (full-text article views including HTML views, PDF and ePub downloads, according to the available data) and Abstracts Views on Vision4Press platform.
Data correspond to usage on the plateform after 2015. The current usage metrics is available 48-96 hours after online publication and is updated daily on week days.
Initial download of the metrics may take a while.