Free Access
Fig. 6.
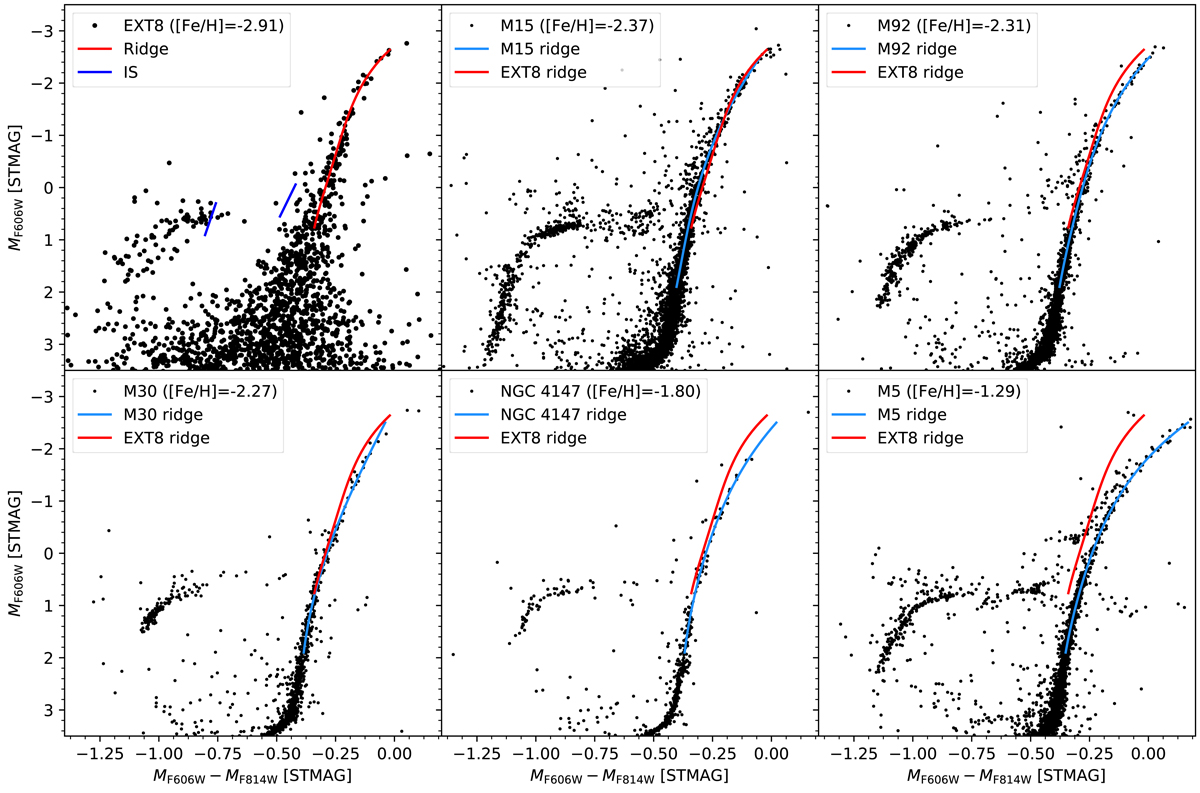
Colour–magnitude diagrams of EXT8 and the Galactic GCs M 15, M 92, M 30, NGC 4147, and M 5 (in order of increasing metallicity). In each panel, the red curve is the EXT8 ridge line and the blue curves are the ridge lines for the Galactic GCs. The boundaries of the instability strip (IS) are indicated in the CMD of EXT8.
Current usage metrics show cumulative count of Article Views (full-text article views including HTML views, PDF and ePub downloads, according to the available data) and Abstracts Views on Vision4Press platform.
Data correspond to usage on the plateform after 2015. The current usage metrics is available 48-96 hours after online publication and is updated daily on week days.
Initial download of the metrics may take a while.