Fig. 4.
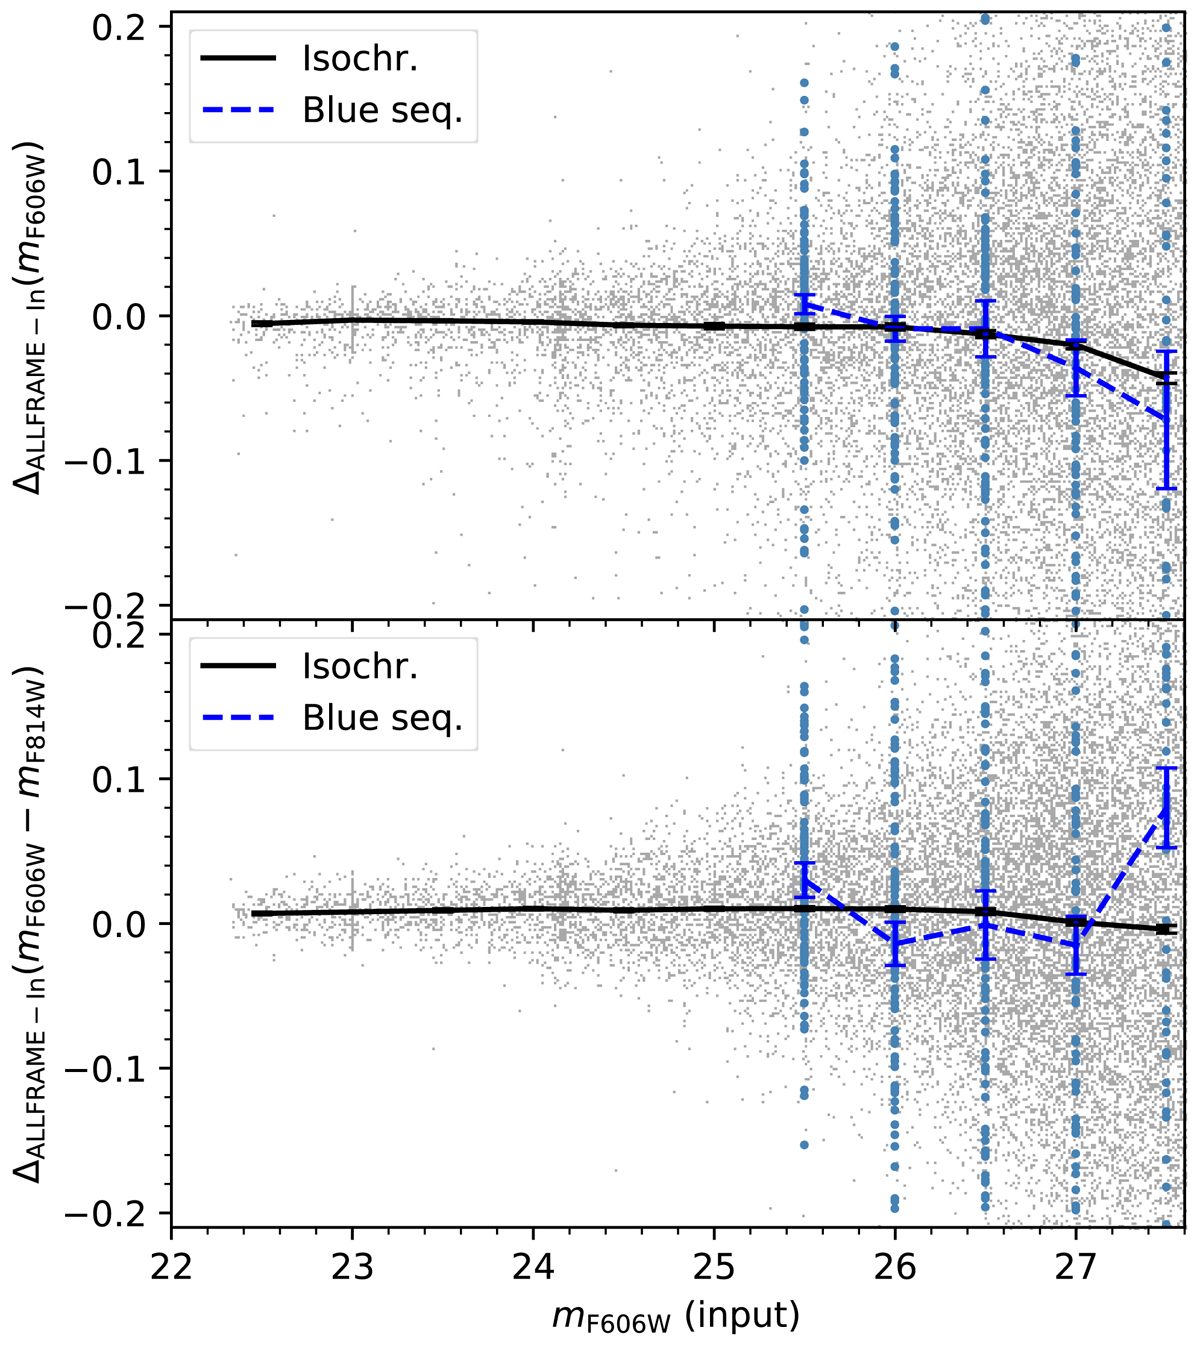
Difference between input and ALLFRAME measurements of mF606W magnitudes (top) and mF606W − mF814W colours (bottom) for artificial star experiments. Solid black lines show median values for artificial stars sampled from isochrones (grey points) while dashed blue lines show median values for artificial stars on the blue sequence (blue dots).
Current usage metrics show cumulative count of Article Views (full-text article views including HTML views, PDF and ePub downloads, according to the available data) and Abstracts Views on Vision4Press platform.
Data correspond to usage on the plateform after 2015. The current usage metrics is available 48-96 hours after online publication and is updated daily on week days.
Initial download of the metrics may take a while.