Fig. 3.
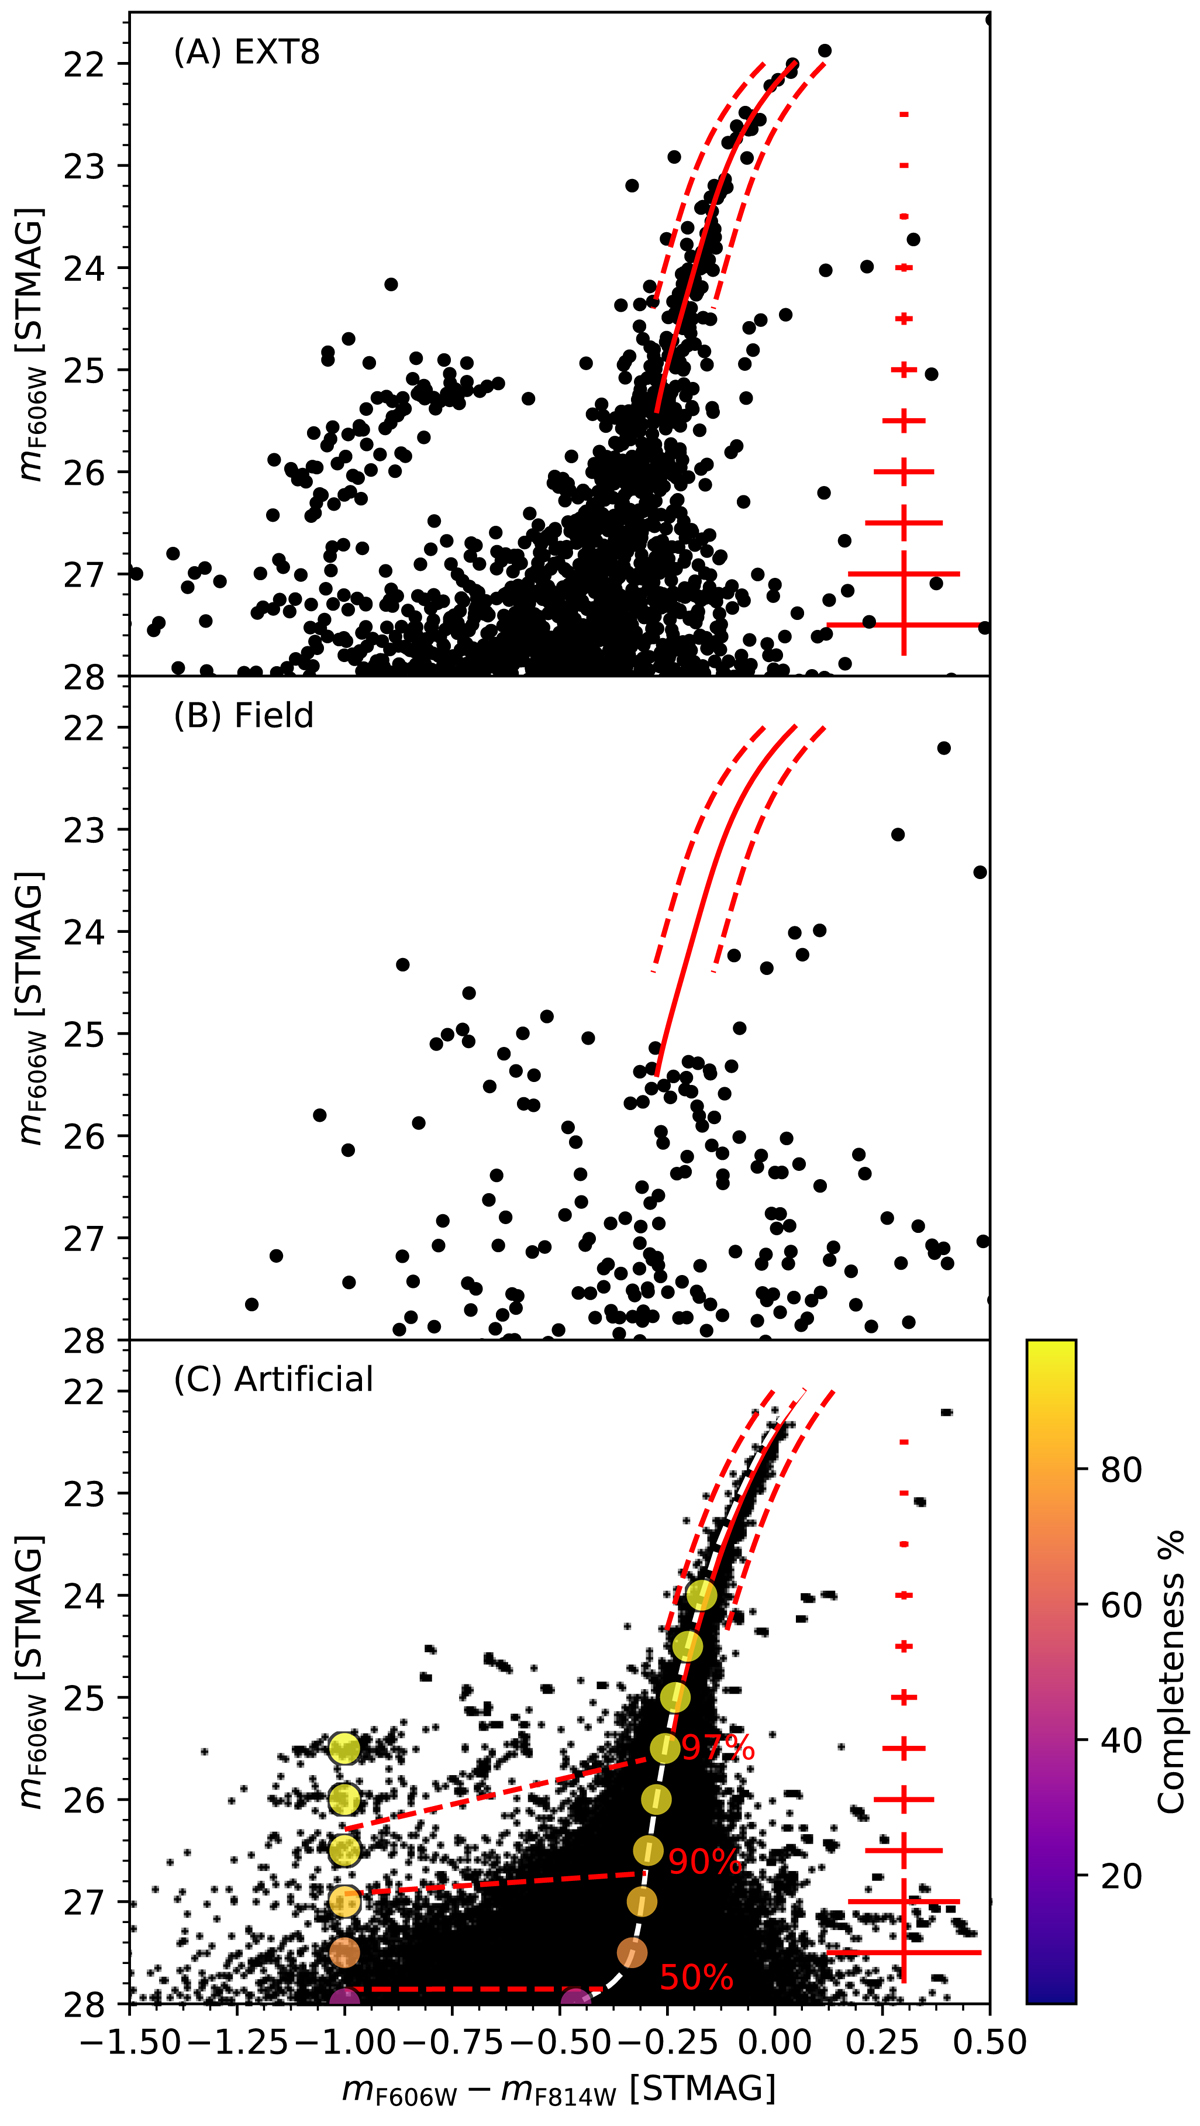
Colour–magnitude diagrams for EXT8 (A), a field region (B), and the artificial cluster used to quantify completeness and photometric errors (C). Ridge lines (polynomial fits) are shown with red curves and the parallel dashed curves mark the regions within which colour spreads are shown in Fig. 10. In panel C, the coloured circles indicate the completeness according to the scale on the right. The 50%, 90%, and 97% completeness levels on the blue sequence and on the isochrone are connected with dashed lines. Error bars indicate the dispersion of the measured colours and magnitudes for the artificial stars around their input values.
Current usage metrics show cumulative count of Article Views (full-text article views including HTML views, PDF and ePub downloads, according to the available data) and Abstracts Views on Vision4Press platform.
Data correspond to usage on the plateform after 2015. The current usage metrics is available 48-96 hours after online publication and is updated daily on week days.
Initial download of the metrics may take a while.