Fig. 17.
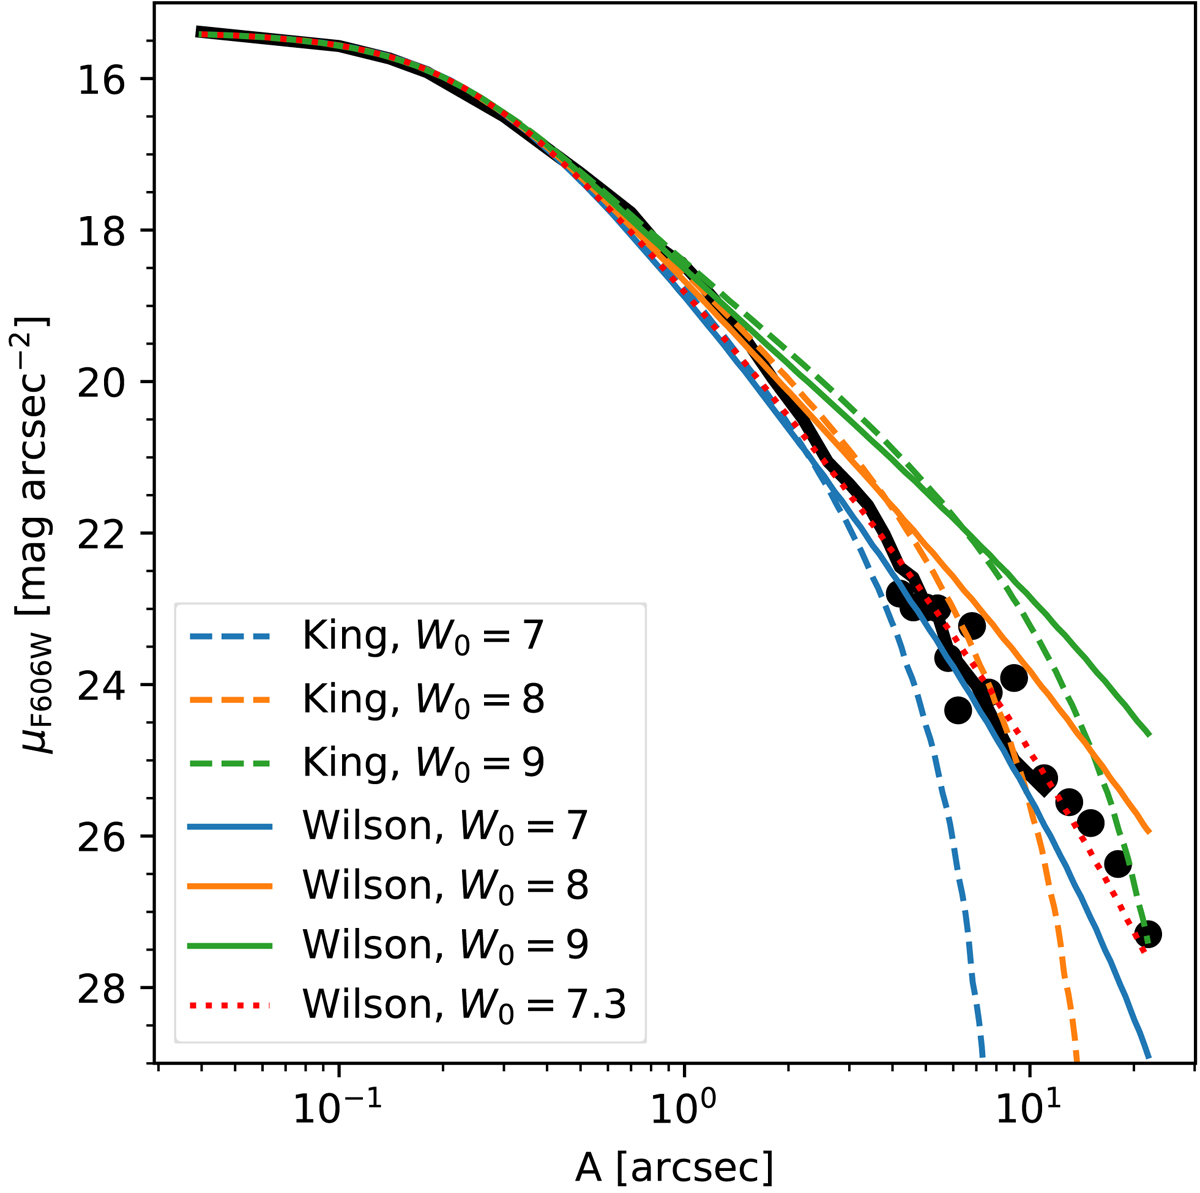
Surface brightness profile of EXT8 and various model profiles, both shown versus semi-major axis A. Filled circles are based on star counts, the solid black curve on surface photometry. King (1966) and Wilson (1975) models are drawn with dashed and solid curves. The best-fitting model, a Wilson model with W0 = 7.3, is plotted as a dotted curve.
Current usage metrics show cumulative count of Article Views (full-text article views including HTML views, PDF and ePub downloads, according to the available data) and Abstracts Views on Vision4Press platform.
Data correspond to usage on the plateform after 2015. The current usage metrics is available 48-96 hours after online publication and is updated daily on week days.
Initial download of the metrics may take a while.