Fig. 2
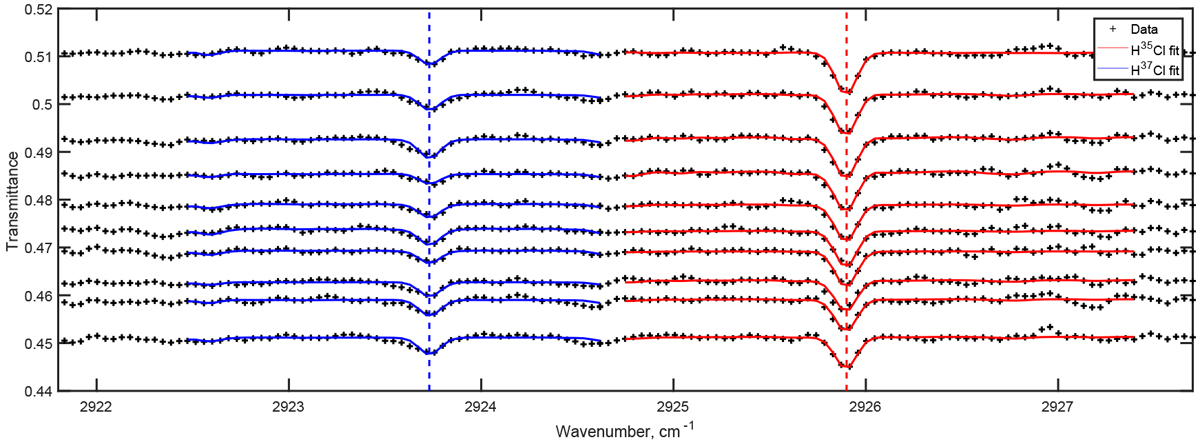
Measured transmittances (black crosses) and the isotopologues absorption lines independent spectral fitting (blue and red curves) for ten detector rows. The vertical separation in the transmittance reflects the actual splits in altitudes and aerosol loadings sounded by different detector rows. All presented spectra are measured simultaneously within one frame. The corresponding tangent altitudes are from 19.1 to 20.6 km. These spectra are recorded at the same location as spectra from Fig. 1; the retrieved VMR of HCl is 1 ppb.
Current usage metrics show cumulative count of Article Views (full-text article views including HTML views, PDF and ePub downloads, according to the available data) and Abstracts Views on Vision4Press platform.
Data correspond to usage on the plateform after 2015. The current usage metrics is available 48-96 hours after online publication and is updated daily on week days.
Initial download of the metrics may take a while.