Fig. 1
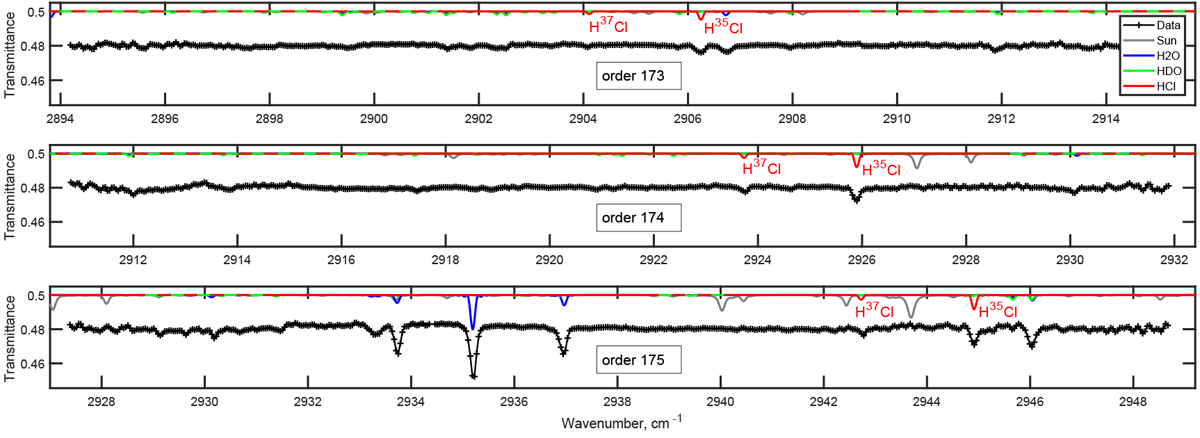
Synthetic transmittance spectra for three diffraction orders measured by ACS MIR in the bottom of the detector frame in the secondary grating position 11. Contributions for water vapour, semi-heavy water vapour, and hydrogen chloride absorption are shown in blue, green, and red, respectively. Solar lines are shown in grey. The example of the measured spectra is shown in black in each diffraction order. The presented spectra are recorded during MY34 at Ls = 288° and latitude −54°S at 19 km tangent altitude.
Current usage metrics show cumulative count of Article Views (full-text article views including HTML views, PDF and ePub downloads, according to the available data) and Abstracts Views on Vision4Press platform.
Data correspond to usage on the plateform after 2015. The current usage metrics is available 48-96 hours after online publication and is updated daily on week days.
Initial download of the metrics may take a while.