Fig. 4
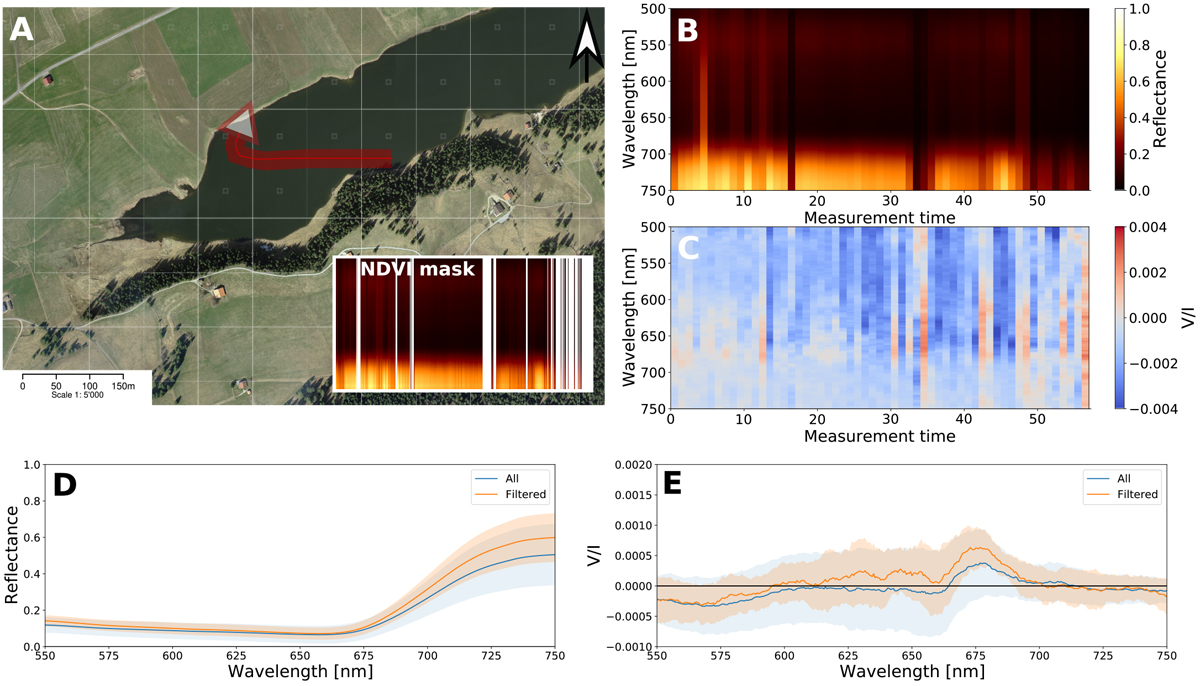
(A) One of the measurement trajectories (in red) over the lake Lac des Taillères in La Brévine, flown in W direction. The inset indicates the filtered classification using NDVI (same color bar and scale as B). Satellite image by: Swiss Federal Authorities, CNES, Spot Image, Swisstopo, NPOC. (B) Qualitative reflectance data for the trajectory per wavelength in time (s). (C) V/I for the trajectory per wavelength in time (s). (D) Time-averaged reflectance for the whole lake and filtered NDVI. (E) Time-averaged circular polarization for the whole lake and filtered NDVI. The shaded areas denote the standard deviation between measurements.
Current usage metrics show cumulative count of Article Views (full-text article views including HTML views, PDF and ePub downloads, according to the available data) and Abstracts Views on Vision4Press platform.
Data correspond to usage on the plateform after 2015. The current usage metrics is available 48-96 hours after online publication and is updated daily on week days.
Initial download of the metrics may take a while.