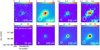
Fig. A.1
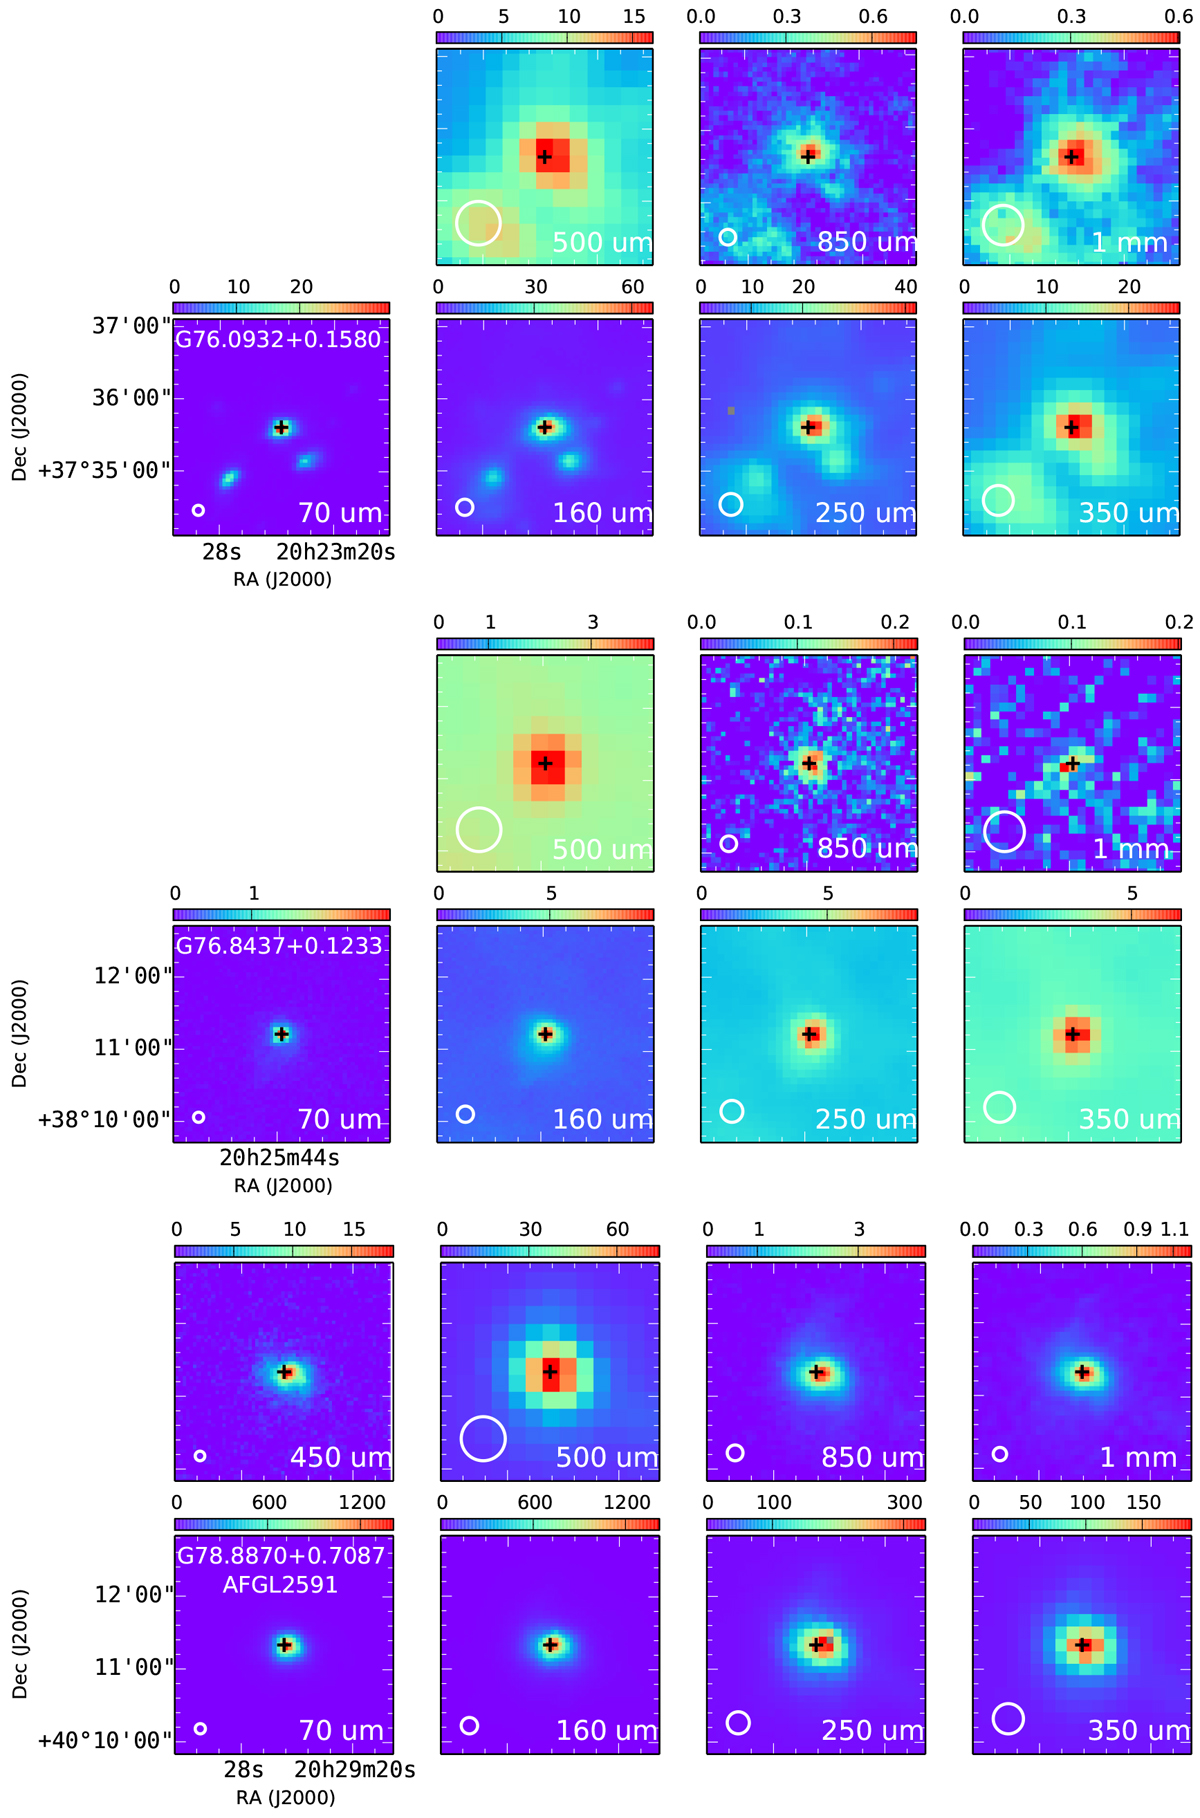
Dust continuum emission images from: Herschel PACS (70 and 160 μm) and SPIRE (250, 350, and 500 μm); JCMT SCUBA-2 (450 and 850 μm); and either IRAM MAMBO/MAMBO-2 (1.2 mm) or CSO Bolocam (1.1 mm) instruments. The color scale is in units of Jy beam−1. The location of the methanol masers detected with the VLA are indicated by the black crosses. The Galactic names of the GLOSTAR sources are indicated at the top of the bottom-left panels. The beams are shown at the bottom-left corner of each panel. Saturated pixels are shown in gray.
Current usage metrics show cumulative count of Article Views (full-text article views including HTML views, PDF and ePub downloads, according to the available data) and Abstracts Views on Vision4Press platform.
Data correspond to usage on the plateform after 2015. The current usage metrics is available 48-96 hours after online publication and is updated daily on week days.
Initial download of the metrics may take a while.