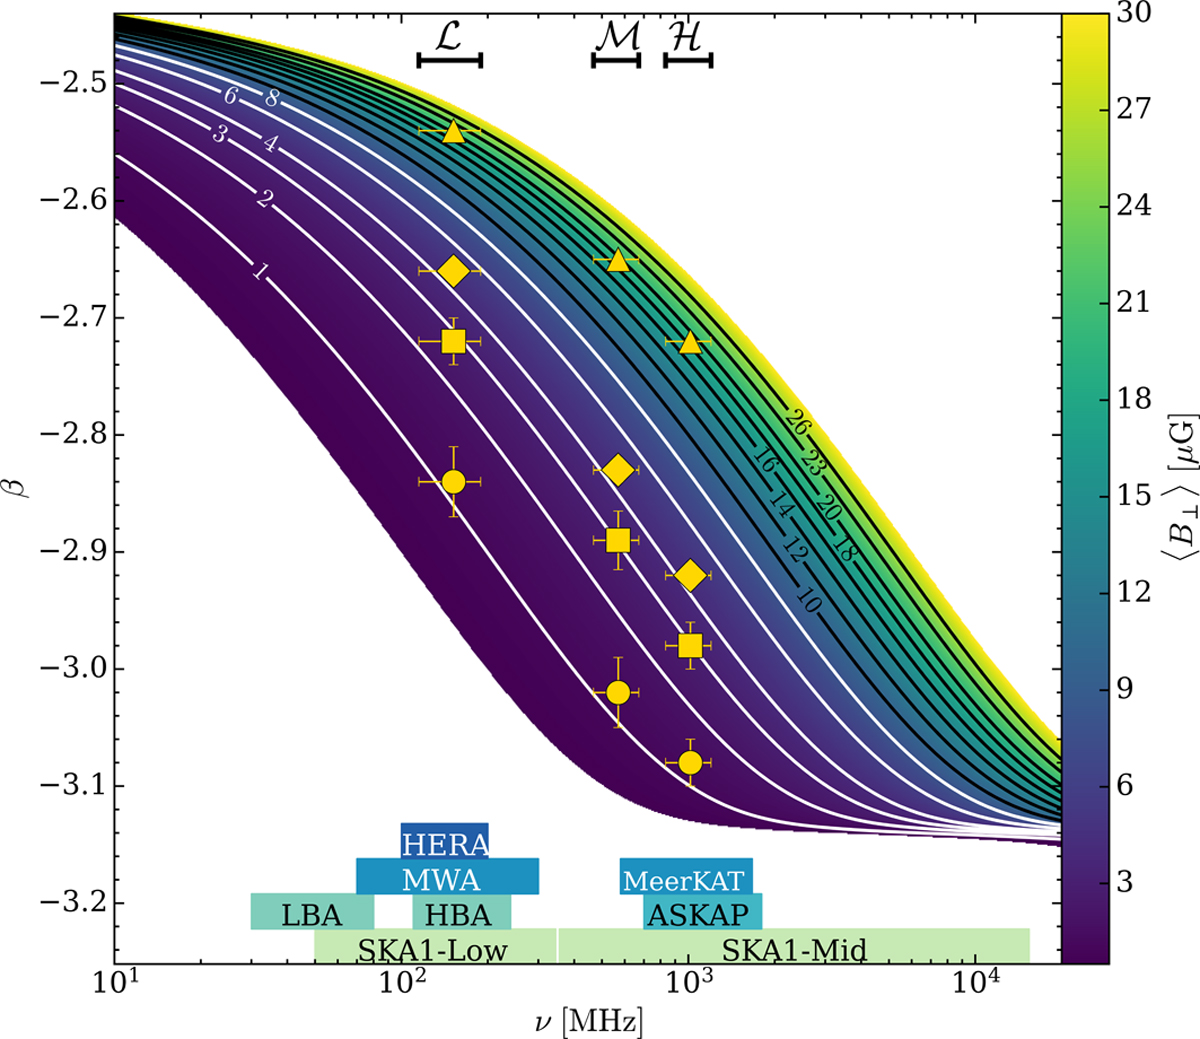
Fig. 9

Look-up plot with which to estimate the average value of B⊥ along a LOS, ⟨B⊥⟩, for a given frequency ν and brightness temperature spectral index β assuming the CRe spectrum by Orlando (2018). Black and white isocontours show specific values of ⟨B⊥⟩ with labels in μG. Yellow symbols indicate estimates of ⟨B⊥⟩ obtained from the values of ![]() in the frequency ranges 115−189 MHz, 467−672 MHz, and 833−1200 MHz (labelled as
in the frequency ranges 115−189 MHz, 467−672 MHz, and 833−1200 MHz (labelled as ![]() ,
,
![]() , and
, and ![]() , respectively)at a common resolution of 6.7′ for the different POSs of the two simulation snapshots (circles: POS yz in the strongfield case; squares: POS yz in the weak field case; diamonds: POS xy and zx in the weak field case; triangles: POS xy and zx in the strong field case). Rectangles at the bottom of the plot show the frequency ranges of the low and high band antenna of LOFAR (LBA and HBA, respectively), the low and mid frequency bands of SKA (SKA1-Low and SKA1-Mid, respectively), and SKA pathfinders and precursors: the Hydrogen Epoch of Reionisation Array (HERA); the Murchison Widefield Array (MWA); the Karoo Array Telescope (MeerKAT); and the Australian SKA Pathfinder (ASKAP).
, respectively)at a common resolution of 6.7′ for the different POSs of the two simulation snapshots (circles: POS yz in the strongfield case; squares: POS yz in the weak field case; diamonds: POS xy and zx in the weak field case; triangles: POS xy and zx in the strong field case). Rectangles at the bottom of the plot show the frequency ranges of the low and high band antenna of LOFAR (LBA and HBA, respectively), the low and mid frequency bands of SKA (SKA1-Low and SKA1-Mid, respectively), and SKA pathfinders and precursors: the Hydrogen Epoch of Reionisation Array (HERA); the Murchison Widefield Array (MWA); the Karoo Array Telescope (MeerKAT); and the Australian SKA Pathfinder (ASKAP).
Current usage metrics show cumulative count of Article Views (full-text article views including HTML views, PDF and ePub downloads, according to the available data) and Abstracts Views on Vision4Press platform.
Data correspond to usage on the plateform after 2015. The current usage metrics is available 48-96 hours after online publication and is updated daily on week days.
Initial download of the metrics may take a while.


