Fig. 9
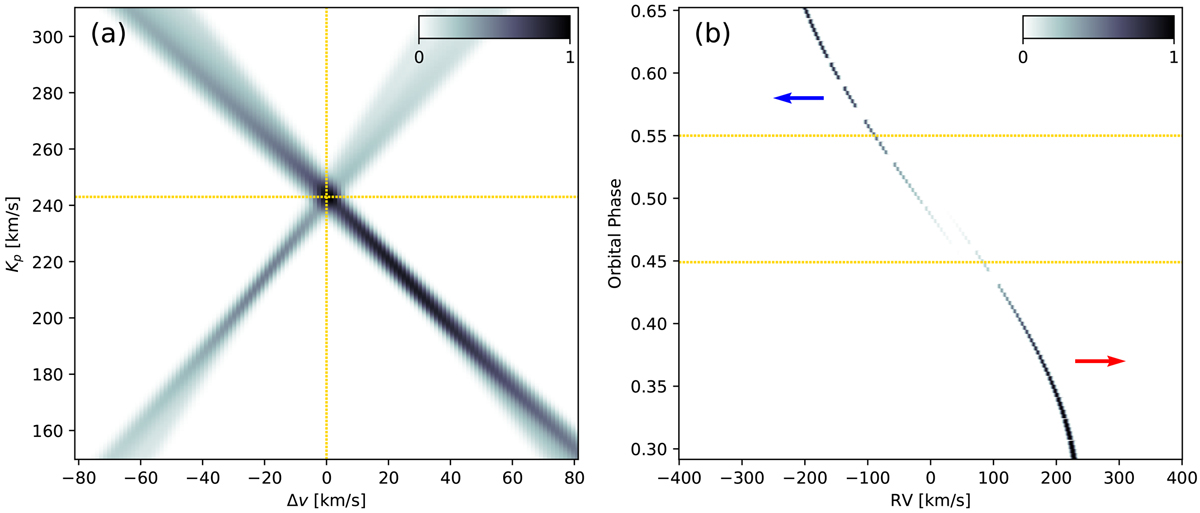
Solution of the toy model for the TiO signal. Panel a: modeled S/N map. The yellow lines indicate the peak value at Kp = 243.0 km s−1. Panel b: modeled CCF map in the stellar rest frame. The yellow lines indicate the begin and end of the secondary eclipse. We also show the continuation of the CCF trail during eclipse for a better understanding. Prior to the secondary eclipse only the terminator region at the east limb is visible to the observer, leading to a red-shift of the TiO signature (shift indicated by red arrow). After eclipse only the blue-shifted TiO signal from the terminator at the west limb is visible (shiftindicated by blue arrow).
Current usage metrics show cumulative count of Article Views (full-text article views including HTML views, PDF and ePub downloads, according to the available data) and Abstracts Views on Vision4Press platform.
Data correspond to usage on the plateform after 2015. The current usage metrics is available 48-96 hours after online publication and is updated daily on week days.
Initial download of the metrics may take a while.