Fig. 7
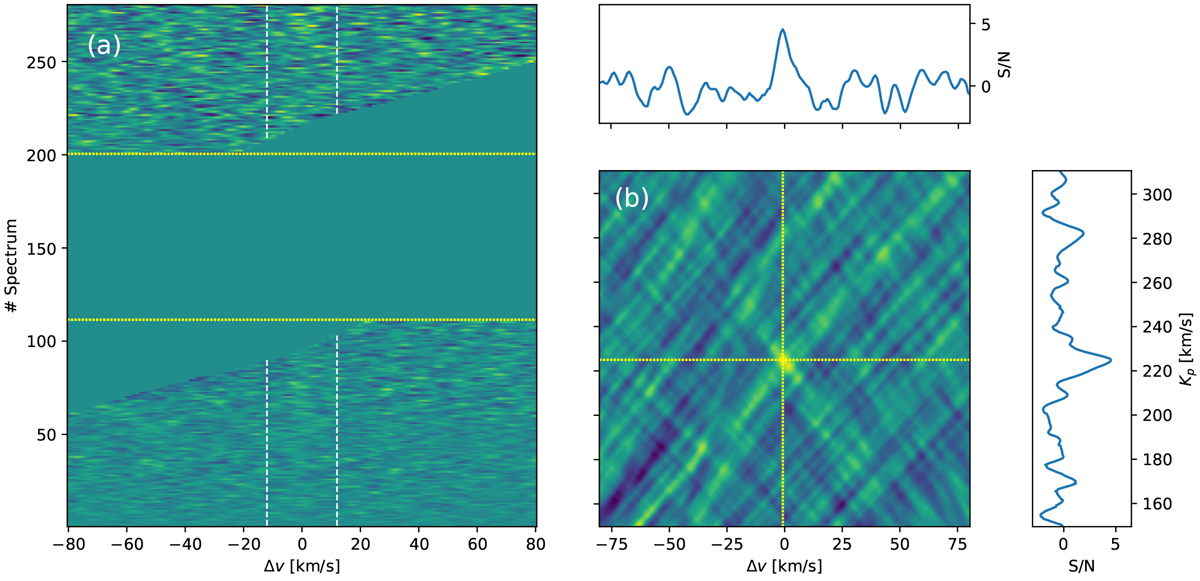
Detection of Fe with HARPS-N. Panel a: CCF map in the planetary rest frame (aligned using Kp = 225.0 km s−1). The vertical trail indicated with white lines is the planetary Fe signal. The two horizontal dashed lines indicate the beginning and end of secondary eclipse. Panel b: signal-to-noise ratio map. The peak coordinates in the S/N map are indicated bythe yellow dashed lines. Cross-sections of the S/N map are shown in the horizontal and vertical panels.
Current usage metrics show cumulative count of Article Views (full-text article views including HTML views, PDF and ePub downloads, according to the available data) and Abstracts Views on Vision4Press platform.
Data correspond to usage on the plateform after 2015. The current usage metrics is available 48-96 hours after online publication and is updated daily on week days.
Initial download of the metrics may take a while.