Fig. 6
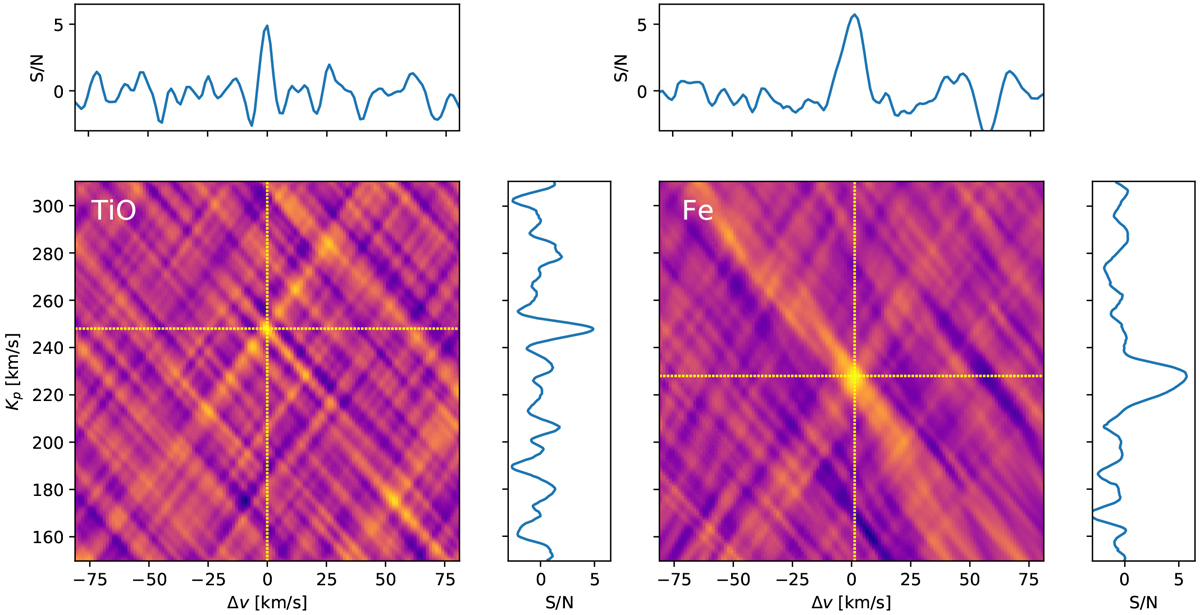
S/N maps after six and five consecutive SYSREM iterations with CARMENES for TiO and Fe, respectively. We get S/N significance levels of 4.9 for TiO and 5.7 for Fe. The peak coordinates in the S/N map are indicated by the yellow dashed lines. Cross-sections of the S/N peaks are reported in the horizontal and vertical panels. The horizontal panels also correspond to the collapsed CCF maps in Fig. 5. The Fe signal is consistent with the expected Kp value; the TiO peak is found with an offset of roughly +17 km s−1.
Current usage metrics show cumulative count of Article Views (full-text article views including HTML views, PDF and ePub downloads, according to the available data) and Abstracts Views on Vision4Press platform.
Data correspond to usage on the plateform after 2015. The current usage metrics is available 48-96 hours after online publication and is updated daily on week days.
Initial download of the metrics may take a while.