Fig. 3
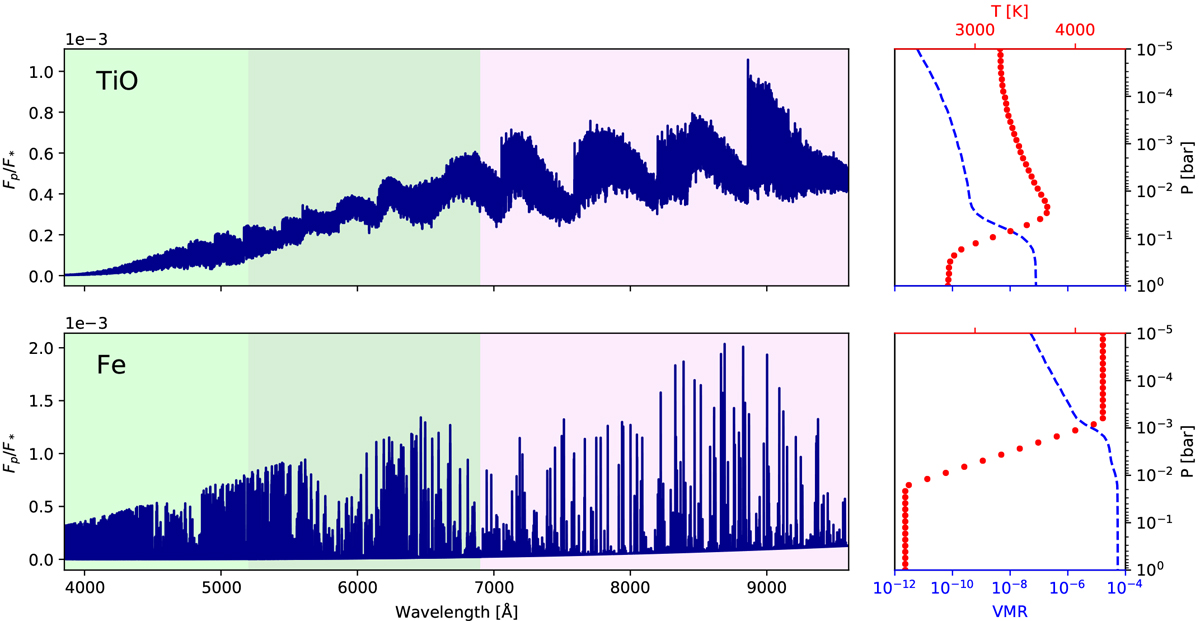
Modeled planetary emission spectra (left panels) and the corresponding T–p profiles with volume mixing ratios (VMRs, right panels). We used different T–p profiles for the two species and computed the VMRs assuming equilibrium chemistry with solar elemental abundances. The upper and the lower panels refer to TiO and Fe, respectively. The CARMENES wavelength range is shaded in pink; the HARPS-N wavelength range is shaded in green; the ranges overlap. The spectral lines are stronger in the CARMENES range when compared to HARPS-N. A different scaling is applied to the planet-to-star flux contrast ratio on the y-axis of the spectra. The spectral lines of Fe are stronger when compared with the TiO model spectrum.
Current usage metrics show cumulative count of Article Views (full-text article views including HTML views, PDF and ePub downloads, according to the available data) and Abstracts Views on Vision4Press platform.
Data correspond to usage on the plateform after 2015. The current usage metrics is available 48-96 hours after online publication and is updated daily on week days.
Initial download of the metrics may take a while.