Fig. C.6
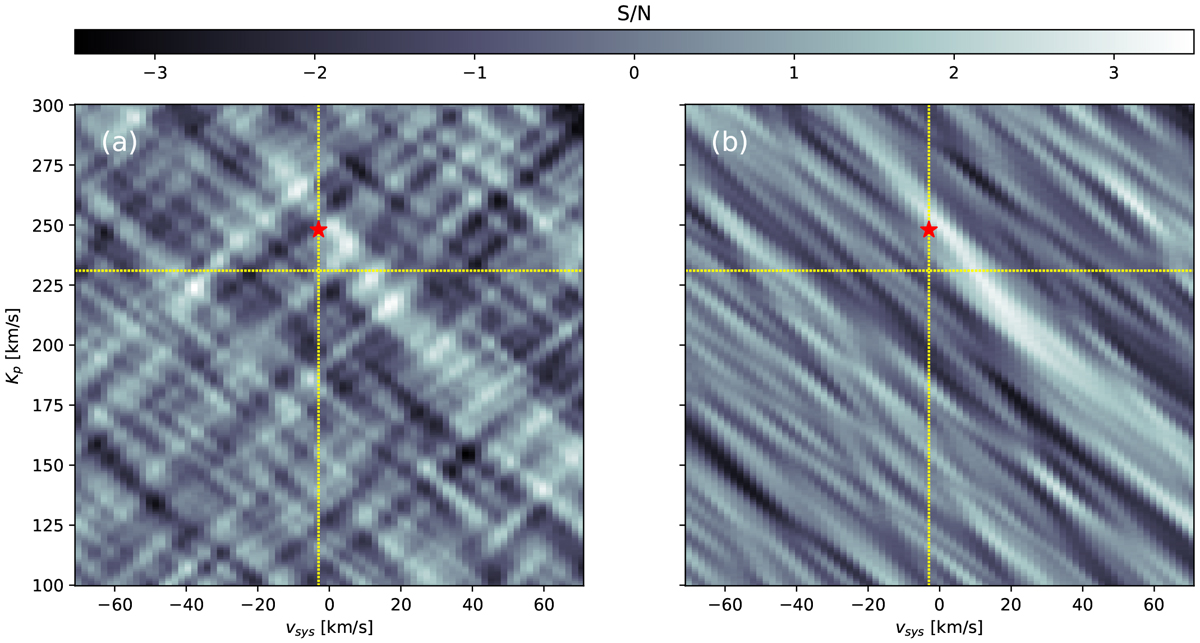
S/N maps of TiO from the ESPaDOnS observations. Panel a represents the S/N map of all spectra; panel b: S/N map of the pre-eclipse TiO signature. The expected orbital parameters are indicated by the yellow dashed lines. A weak TiO signal is located close to the orbital parameters found with CARMENES, which is indicated with a red star (![]() ). Only the spectra before eclipse contribute to the signal. The x-axis is presented in the systemic rest frame (vsys) in order to be consistent with Herman et al. (2020).
). Only the spectra before eclipse contribute to the signal. The x-axis is presented in the systemic rest frame (vsys) in order to be consistent with Herman et al. (2020).
Current usage metrics show cumulative count of Article Views (full-text article views including HTML views, PDF and ePub downloads, according to the available data) and Abstracts Views on Vision4Press platform.
Data correspond to usage on the plateform after 2015. The current usage metrics is available 48-96 hours after online publication and is updated daily on week days.
Initial download of the metrics may take a while.