Fig. C.5
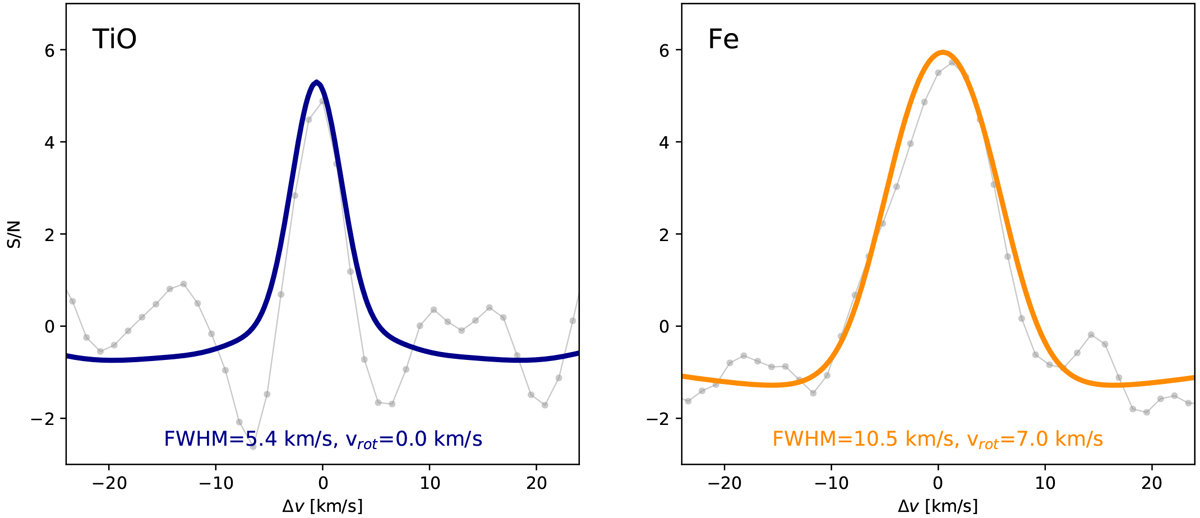
Auto-correlation of the TiO model spectrum (left panel) and cross-correlation between the Fe model spectrum and a rotationally broadened version of itself (vrot = 7 km s−1; right panel). For comparison, we plot the observed CCFs from the CARMENES observations in gray lines. The auto-correlation of the TiO model spectrum has a width of 5.4 km s−1. This is close to the FWHM value of the observed CCF (4.0 ± 0.7 km s−1). Also the FWHM of the cross-correlation with the broadened Fe model spectrum is close to the value of the observed CCF (10.5 km s−1 and 8.6 ± 1.0 km s−1, respectively).
Current usage metrics show cumulative count of Article Views (full-text article views including HTML views, PDF and ePub downloads, according to the available data) and Abstracts Views on Vision4Press platform.
Data correspond to usage on the plateform after 2015. The current usage metrics is available 48-96 hours after online publication and is updated daily on week days.
Initial download of the metrics may take a while.