Fig. C.3
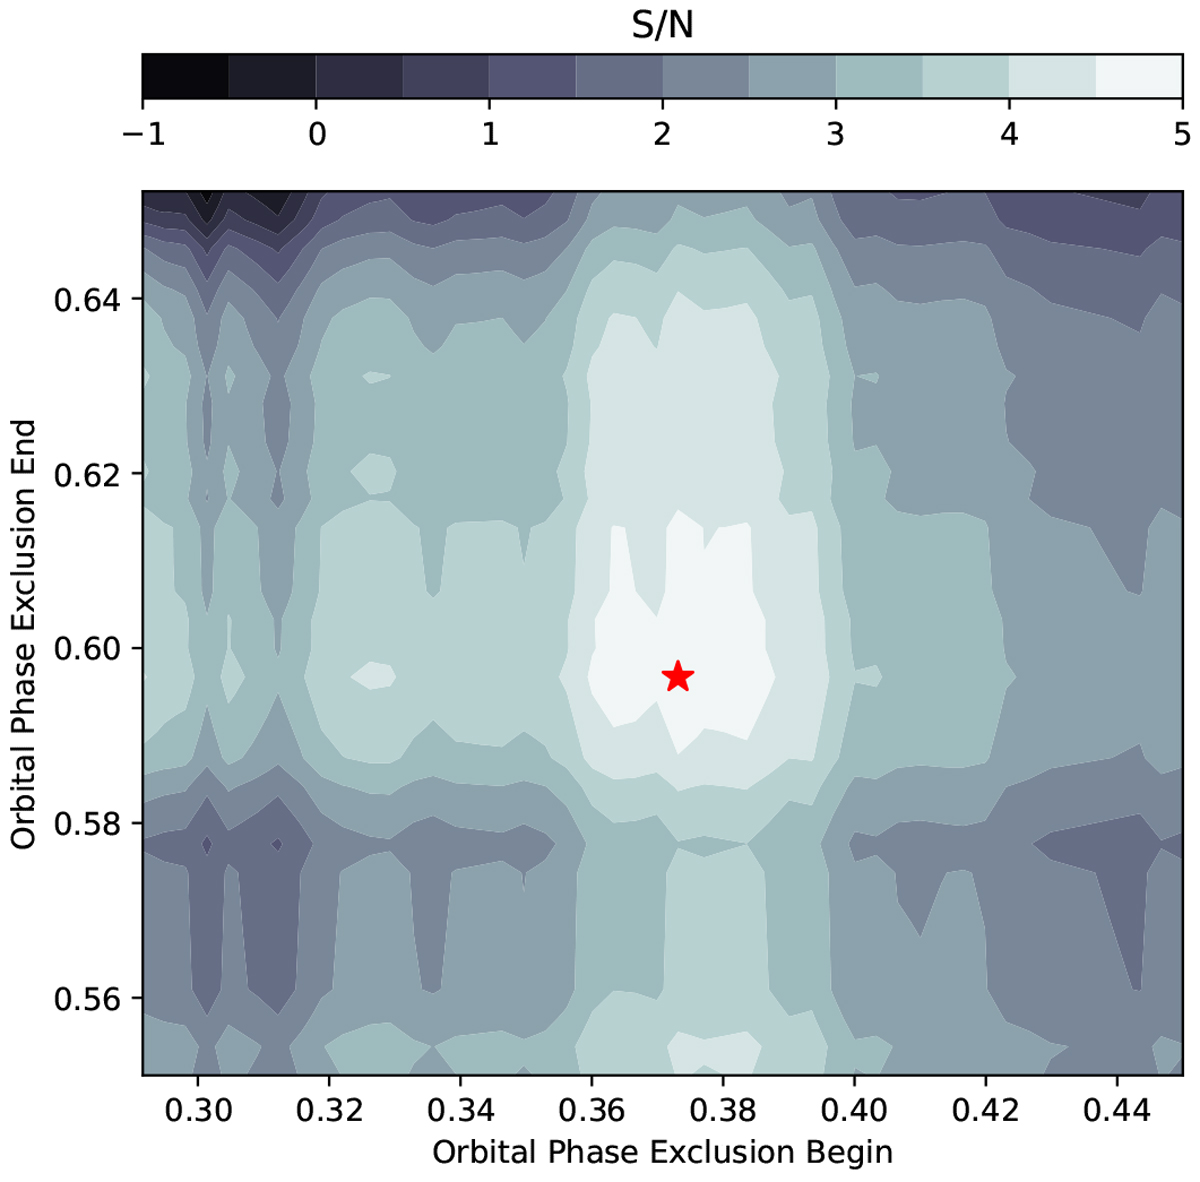
Map of TiO S/N detection significance when excluding different orbital phase ranges around the secondary eclipse (measured at Kp = 248.0 km s−1 and Δv = 0.0 km s−1). The values on the x- and y-axis show the boundaries of the excluded phase intervals. The signal of TiO peaks when the orbital phase interval between ~ 0.37 and ~ 0.60 is excluded. The corresponding phase values are indicated with a red star (![]() ). We checked the exclusion of all possible orbital phase intervals. Phase ranges that are entirely inside eclipse were not considered (between roughly 0.45 and 0.55).
). We checked the exclusion of all possible orbital phase intervals. Phase ranges that are entirely inside eclipse were not considered (between roughly 0.45 and 0.55).
Current usage metrics show cumulative count of Article Views (full-text article views including HTML views, PDF and ePub downloads, according to the available data) and Abstracts Views on Vision4Press platform.
Data correspond to usage on the plateform after 2015. The current usage metrics is available 48-96 hours after online publication and is updated daily on week days.
Initial download of the metrics may take a while.