Fig. C.2
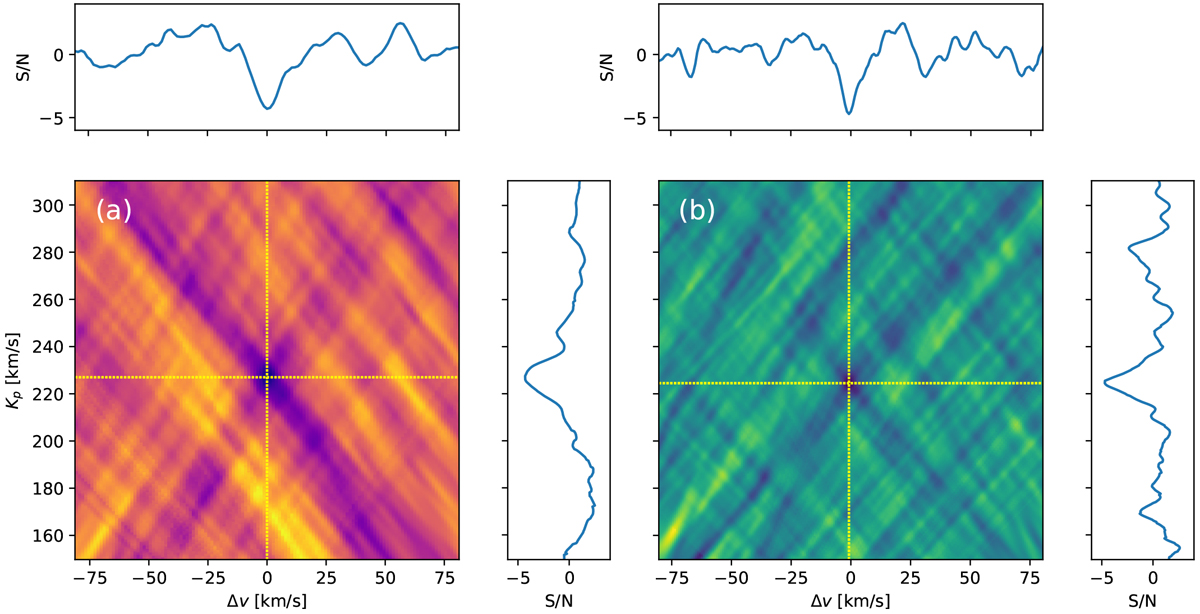
S/N maps of Fe obtained by using a non-inverted T–p profile for cross-correlation (Nugroho et al. 2017). Panel a: anticorrelation signal of Fe in the CARMENES data (S/N = −4.3); panel b: anticorrelation with the HARPS-N data (S/N = −4.6). The coordinates of the negative S/N peaks are indicated by the yellow dashed lines. The cross-sections of the negative S/N peaks are reported in the horizontal and vertical panels. Each S/N map corresponds to the SYSREM iteration number that maximizes the detection strength in Sects. 5.1 and 5.2.
Current usage metrics show cumulative count of Article Views (full-text article views including HTML views, PDF and ePub downloads, according to the available data) and Abstracts Views on Vision4Press platform.
Data correspond to usage on the plateform after 2015. The current usage metrics is available 48-96 hours after online publication and is updated daily on week days.
Initial download of the metrics may take a while.