Fig. B.1
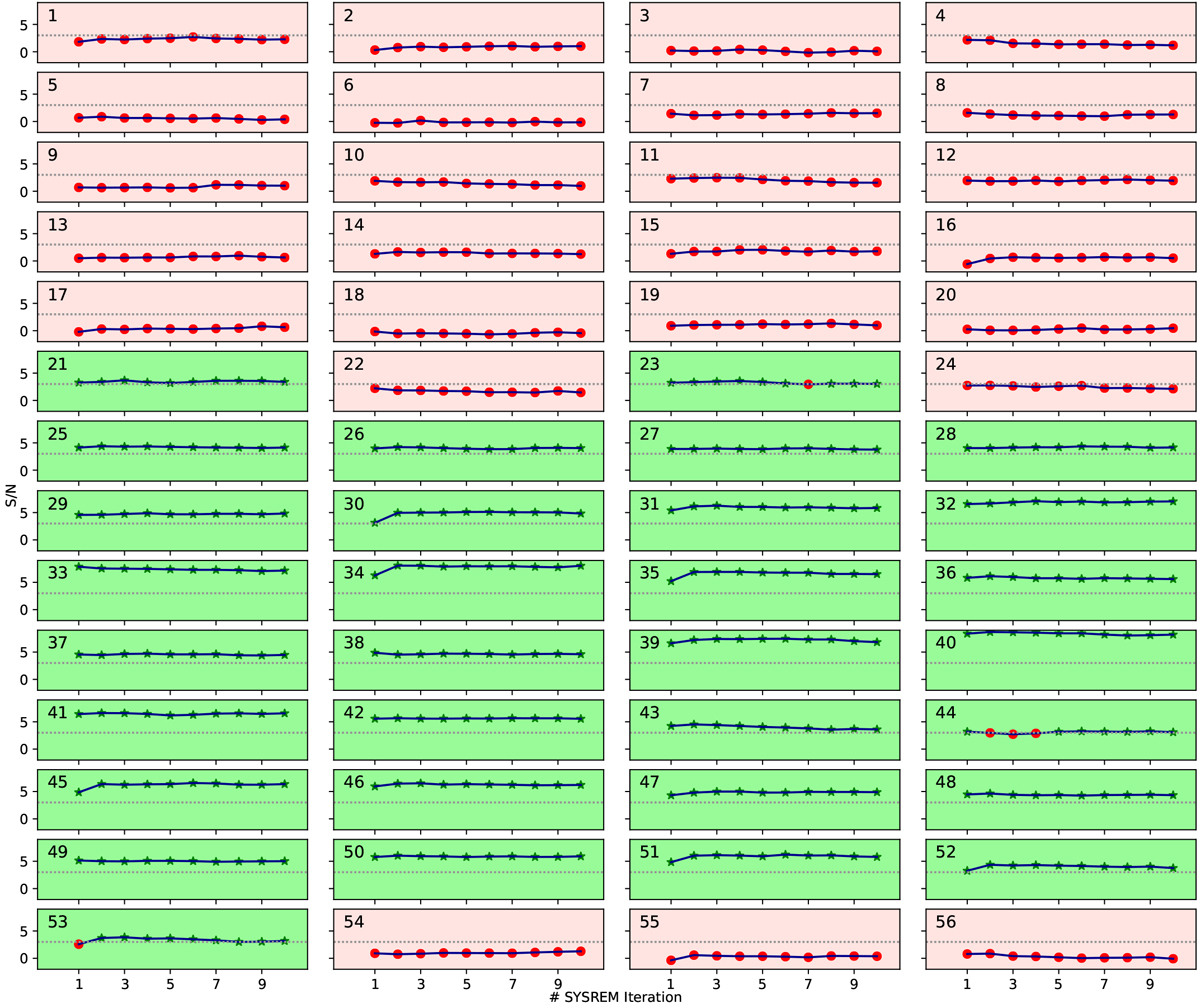
Strength of the injected TiO model spectrum. The x-axis represents the number of consecutive SYSREM iterations; the y-axis measures the S/N detection strength of the injected model spectrum. Each panel is labeled with the number of the corresponding spectral order. Data points marked with green stars (![]() ) correspond to a detection, red circles (
) correspond to a detection, red circles (![]() ) to a non-detection of the injected model. The horizontal gray line corresponds to S/N = 3. We consider a spectral order to be good, if the injected model spectrum is detected at S/N > 3 for at least one specific number of SYSREM iterations. Spectral orders shaded with green are considered to be good orders, orders shaded with red to be bad orders. Although we got detections of the injected model in orders 50 and 51, we observed a strong enhancement of noise the in the final S/N detection map if we included them (cf. Sect. 4.4). We concluded that these orders have an increased noise level and excluded them from the list of good orders.
) to a non-detection of the injected model. The horizontal gray line corresponds to S/N = 3. We consider a spectral order to be good, if the injected model spectrum is detected at S/N > 3 for at least one specific number of SYSREM iterations. Spectral orders shaded with green are considered to be good orders, orders shaded with red to be bad orders. Although we got detections of the injected model in orders 50 and 51, we observed a strong enhancement of noise the in the final S/N detection map if we included them (cf. Sect. 4.4). We concluded that these orders have an increased noise level and excluded them from the list of good orders.
Current usage metrics show cumulative count of Article Views (full-text article views including HTML views, PDF and ePub downloads, according to the available data) and Abstracts Views on Vision4Press platform.
Data correspond to usage on the plateform after 2015. The current usage metrics is available 48-96 hours after online publication and is updated daily on week days.
Initial download of the metrics may take a while.