Fig. A.1
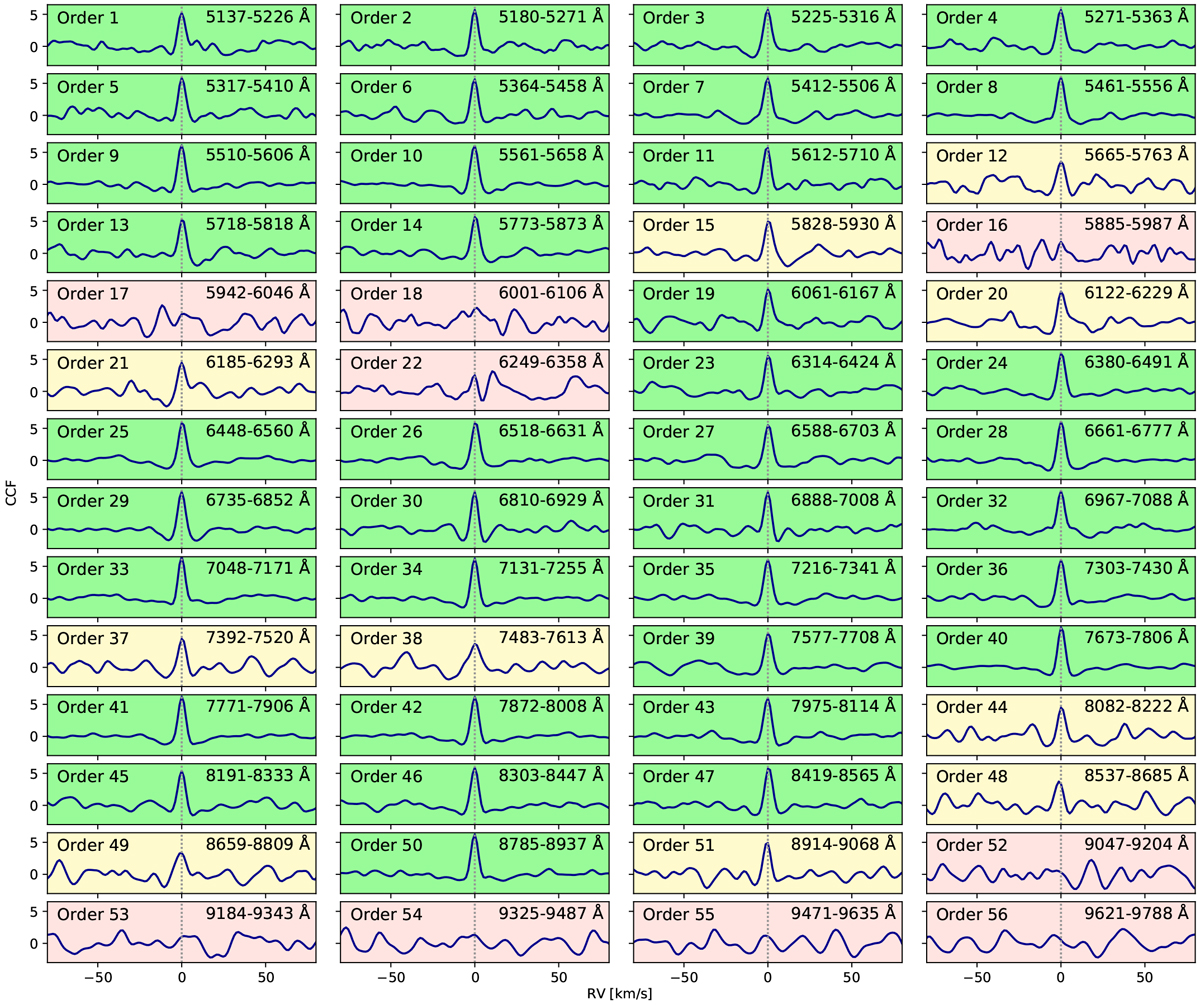
CCFs between the TiO transmission model and the high-resolution spectrum of Barnard’s star for CARMENES. The x-axis represents the radial velocity offset from the stellar rest frame; the y-axis measures the CCF in units of standard deviation. The yellow and green shaded panels indicate the spectral orders with a CCF peak greater than three and five standard deviations, respectively. Red shaded panels represent spectral orders not showing any correlation.
Current usage metrics show cumulative count of Article Views (full-text article views including HTML views, PDF and ePub downloads, according to the available data) and Abstracts Views on Vision4Press platform.
Data correspond to usage on the plateform after 2015. The current usage metrics is available 48-96 hours after online publication and is updated daily on week days.
Initial download of the metrics may take a while.