Free Access
Fig. 5
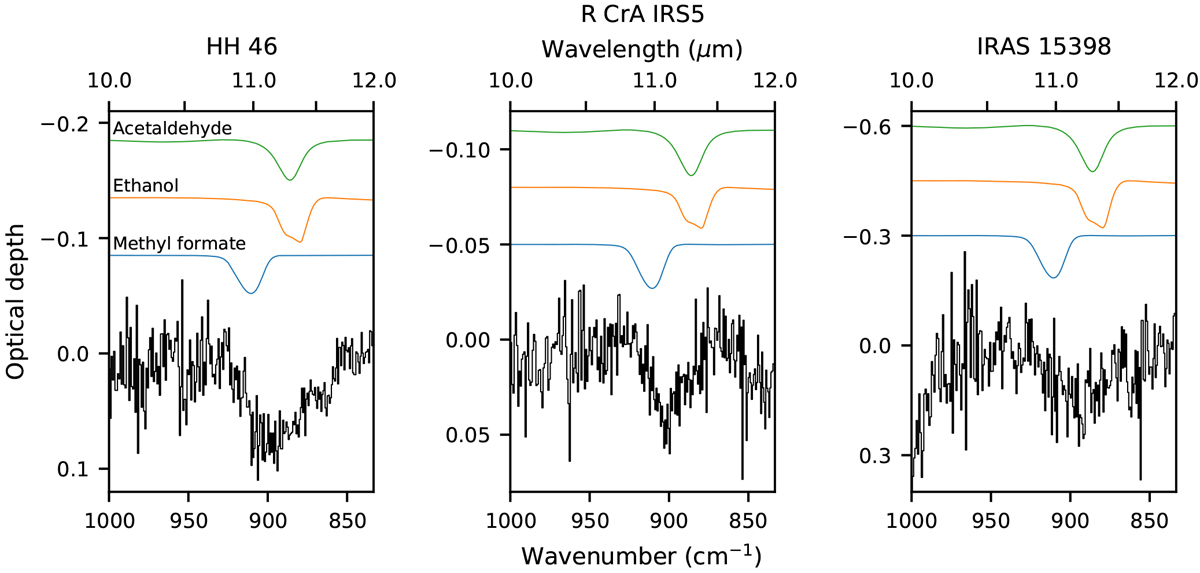
Spitzer CASSIS pipeline spectra of R Cra IRS5, HH 46, and IRAS 15398 (from left to right) in the 10–14 μm region. The spectra on top are derived from labortory data for pure acetaldehyde, ethanol, and methyl formate recorded at 15 K.
Current usage metrics show cumulative count of Article Views (full-text article views including HTML views, PDF and ePub downloads, according to the available data) and Abstracts Views on Vision4Press platform.
Data correspond to usage on the plateform after 2015. The current usage metrics is available 48-96 hours after online publication and is updated daily on week days.
Initial download of the metrics may take a while.