Fig. 6.
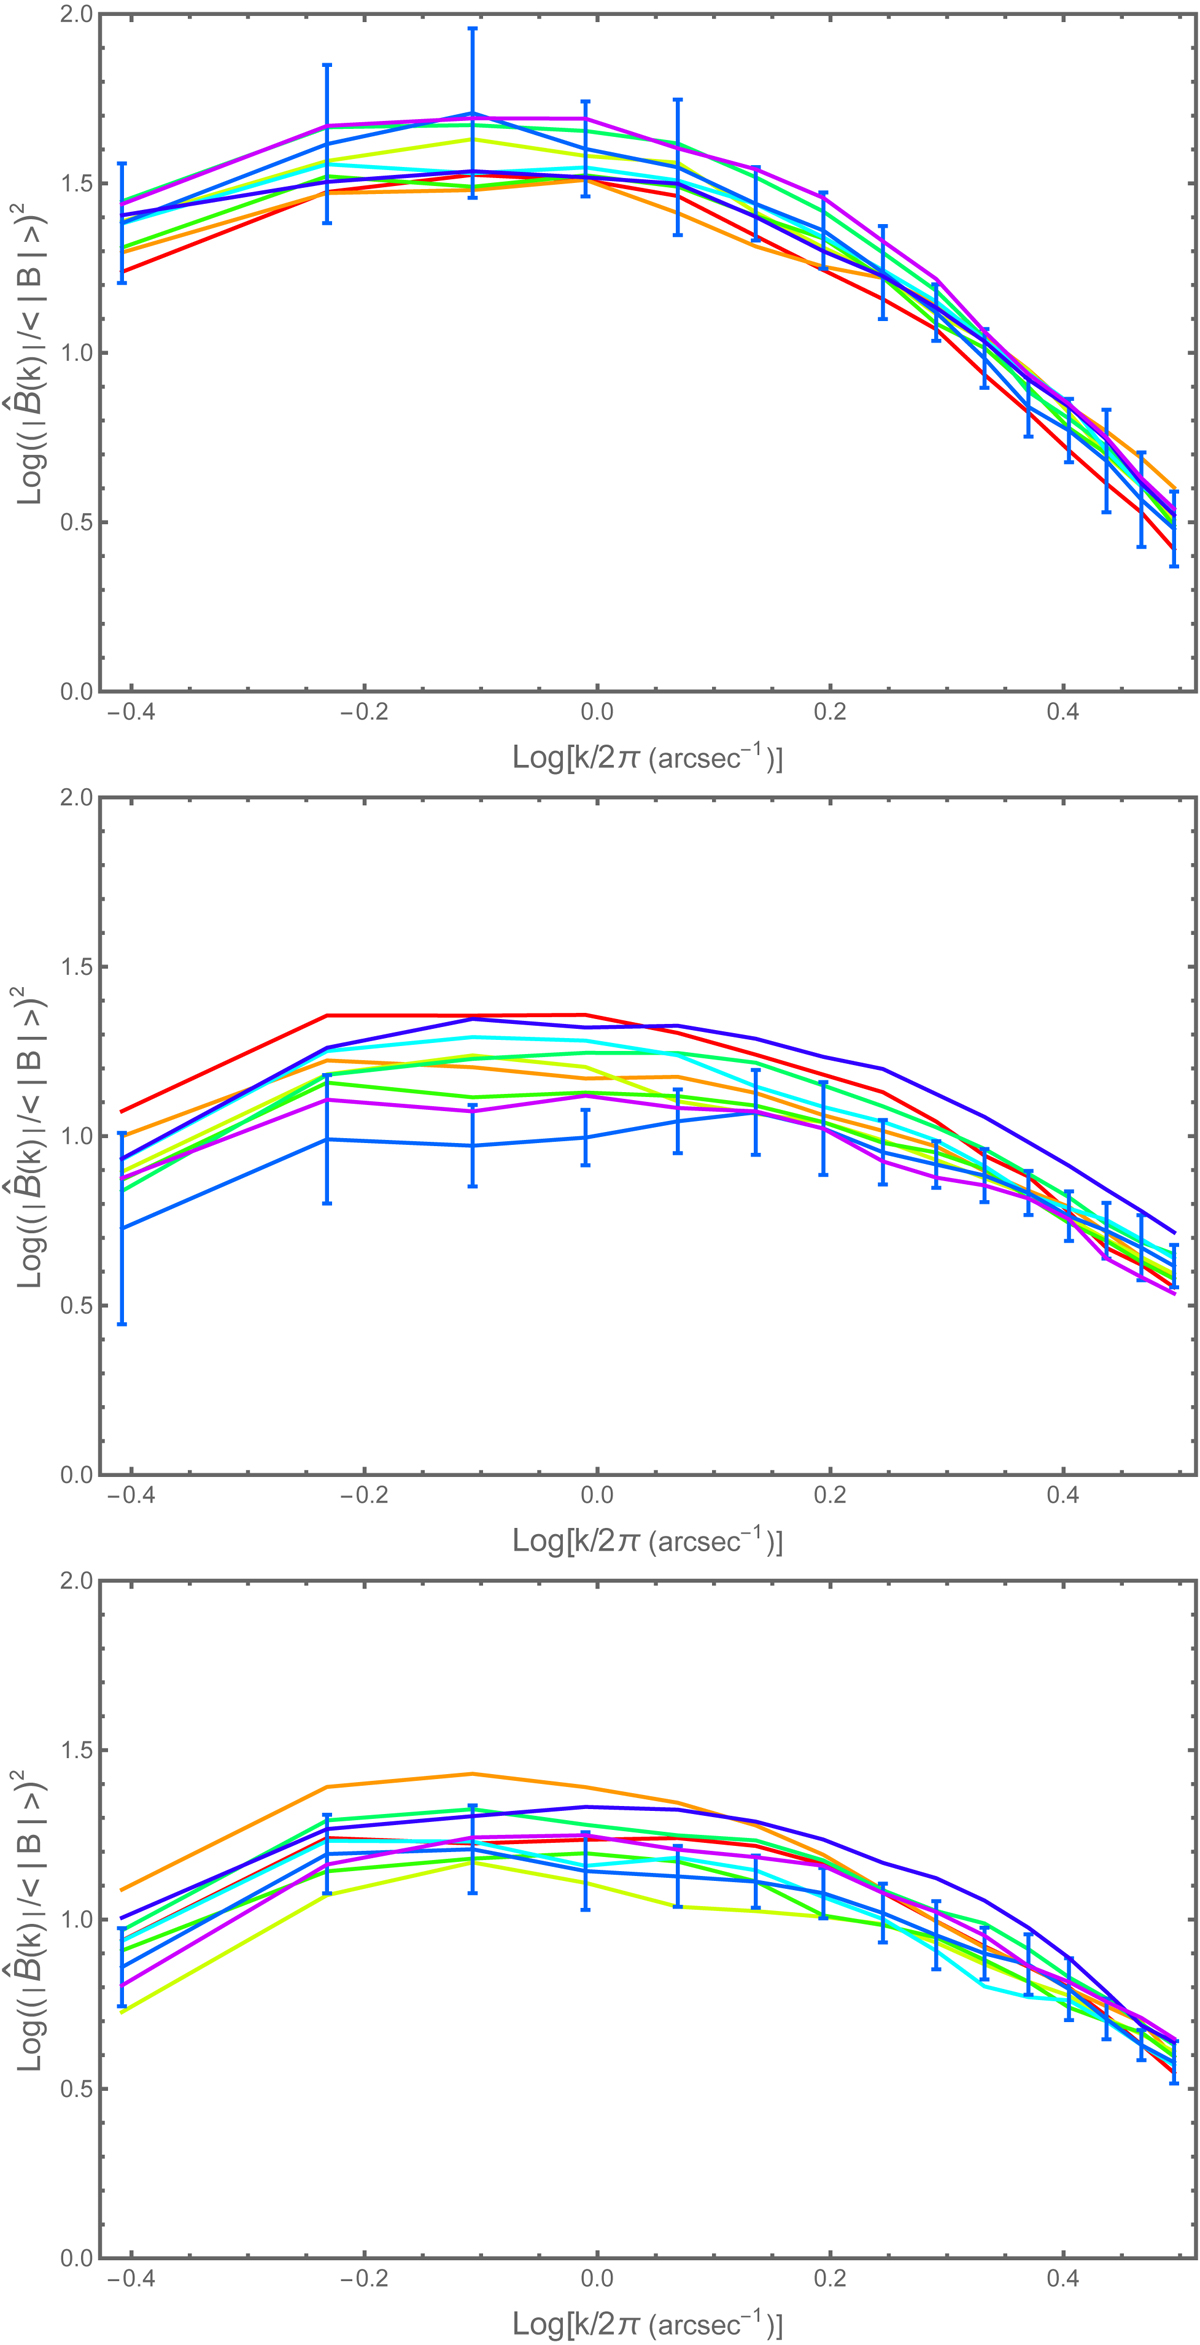
Power spectra of the spatial fluctuations of the unsigned magnetic flux density in the IN regions for observations performed between 2008 and 2016, on a log−log scale. The bars show the ±σ intervals on the 2014 data set. Color coded as in Fig. 5. Top panel: at disk center; middle panel: at high latitude in the southern hemisphere; and bottom panel: at high latitude in the northern hemisphere.
Current usage metrics show cumulative count of Article Views (full-text article views including HTML views, PDF and ePub downloads, according to the available data) and Abstracts Views on Vision4Press platform.
Data correspond to usage on the plateform after 2015. The current usage metrics is available 48-96 hours after online publication and is updated daily on week days.
Initial download of the metrics may take a while.