Fig. 5.
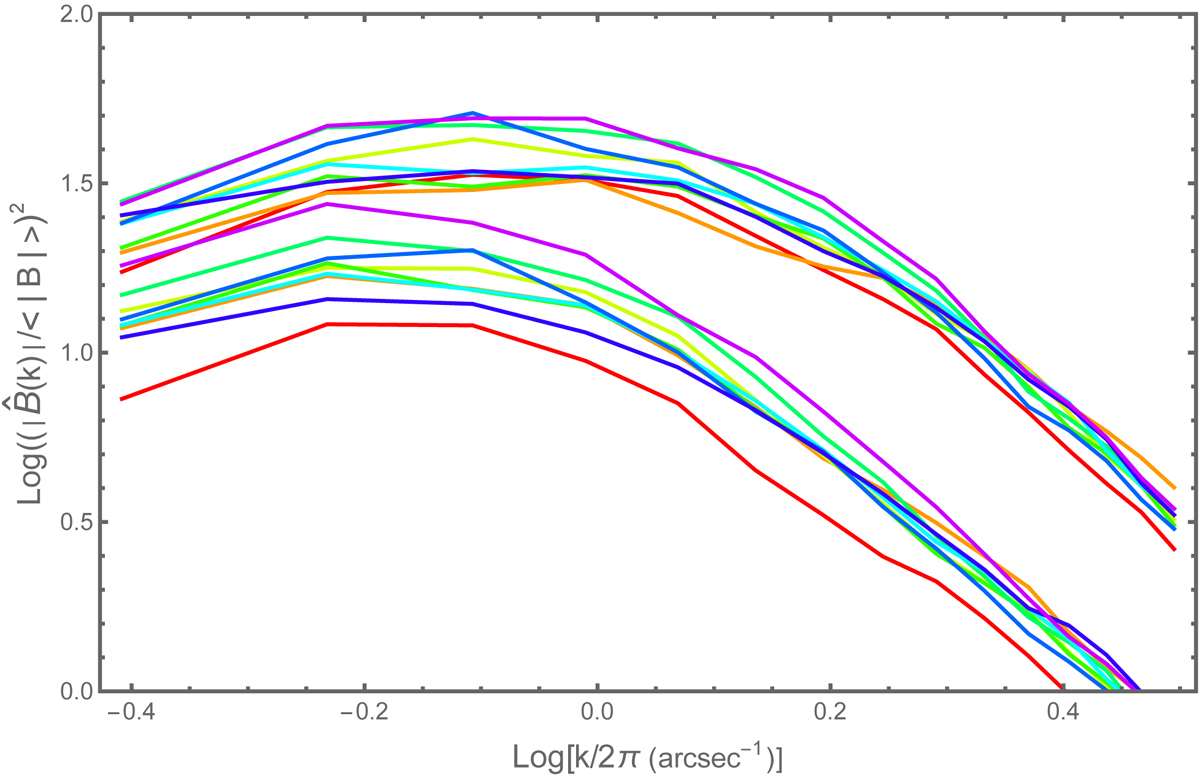
Power spectra of the spatial fluctuations of the unsigned magnetic flux density in the IN regions at the center of the solar disk, for observations performed between 2008 and 2016 on a log−log scale. The upper set of curves are obtained from PSF corrected maps, whereas the lower set is from uncorrected maps. Red line: 2008; orange: 2009; light green: 2010; green: 2011; deep green: 2012; light blue: 2013; blue: 2014; deep blue line: 2015; and purple: 2016.
Current usage metrics show cumulative count of Article Views (full-text article views including HTML views, PDF and ePub downloads, according to the available data) and Abstracts Views on Vision4Press platform.
Data correspond to usage on the plateform after 2015. The current usage metrics is available 48-96 hours after online publication and is updated daily on week days.
Initial download of the metrics may take a while.