Open Access
Fig. 10.
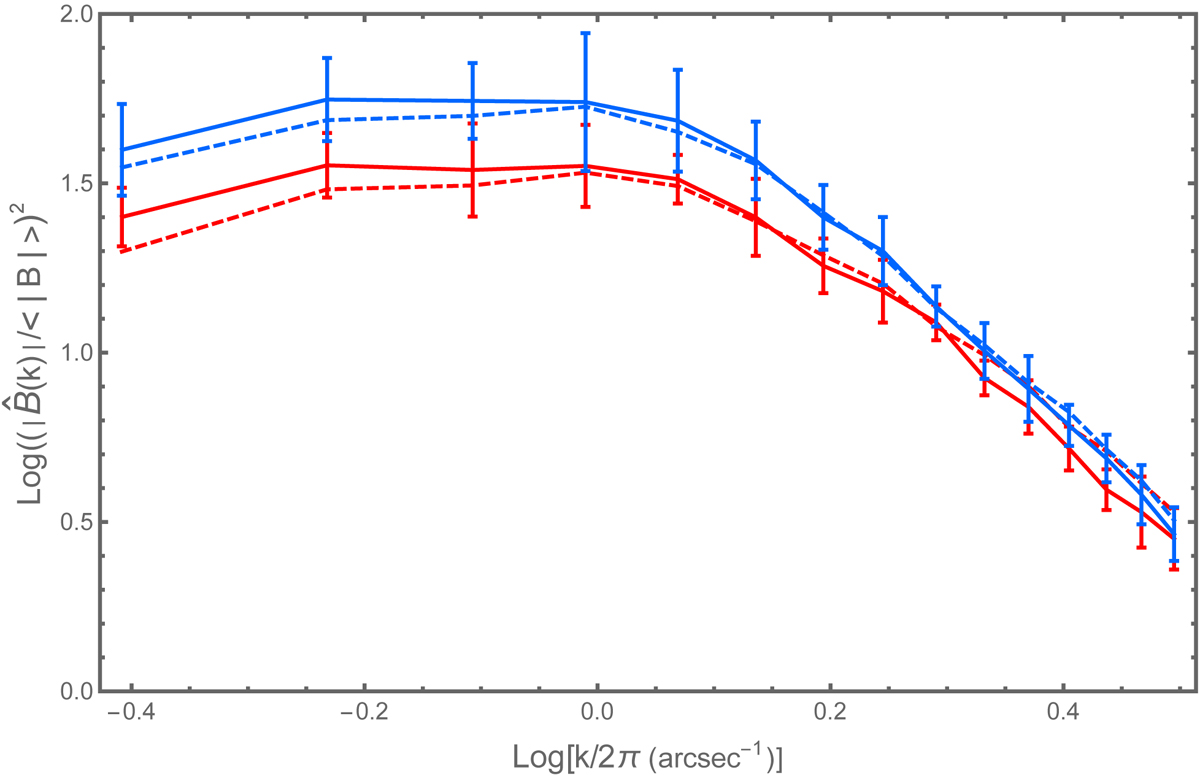
Power spectra of the spatial fluctuations of the unsigned magnetic flux density in the IN regions at the active latitude θ = −18°. Full lines: from the FeI 630.25 nm line; dashed lines: from the FeI 630.15 nm line. Blue lines: in 2014; red lines: in 2008. The bars show the ±σ intervals.
Current usage metrics show cumulative count of Article Views (full-text article views including HTML views, PDF and ePub downloads, according to the available data) and Abstracts Views on Vision4Press platform.
Data correspond to usage on the plateform after 2015. The current usage metrics is available 48-96 hours after online publication and is updated daily on week days.
Initial download of the metrics may take a while.