Fig. 5.
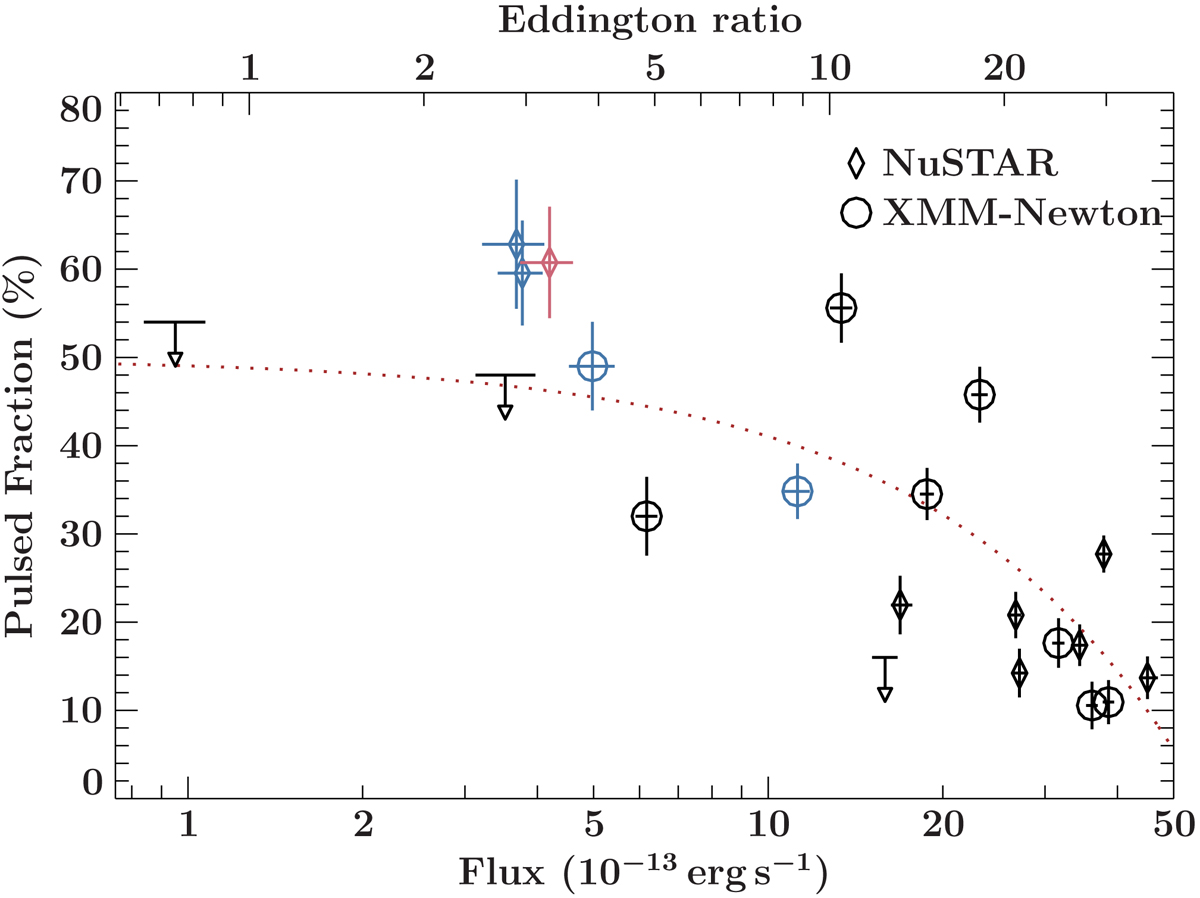
Pulsed fraction in the 3−10 keV band as a function of flux in the same energy band. NuSTAR data are shown as diamonds, XMM-Newton data are shown as circles. Data from 2019 are shown in blue, data from 2020 are shown in red. The brown dotted line shows a simple linear regression to the data. The top y-axis gives the flux as a fraction of the Eddington ratio for a 1.4 M⊙ neutron star at a distance of 3.4 Mpc.
Current usage metrics show cumulative count of Article Views (full-text article views including HTML views, PDF and ePub downloads, according to the available data) and Abstracts Views on Vision4Press platform.
Data correspond to usage on the plateform after 2015. The current usage metrics is available 48-96 hours after online publication and is updated daily on week days.
Initial download of the metrics may take a while.