Fig. 4.
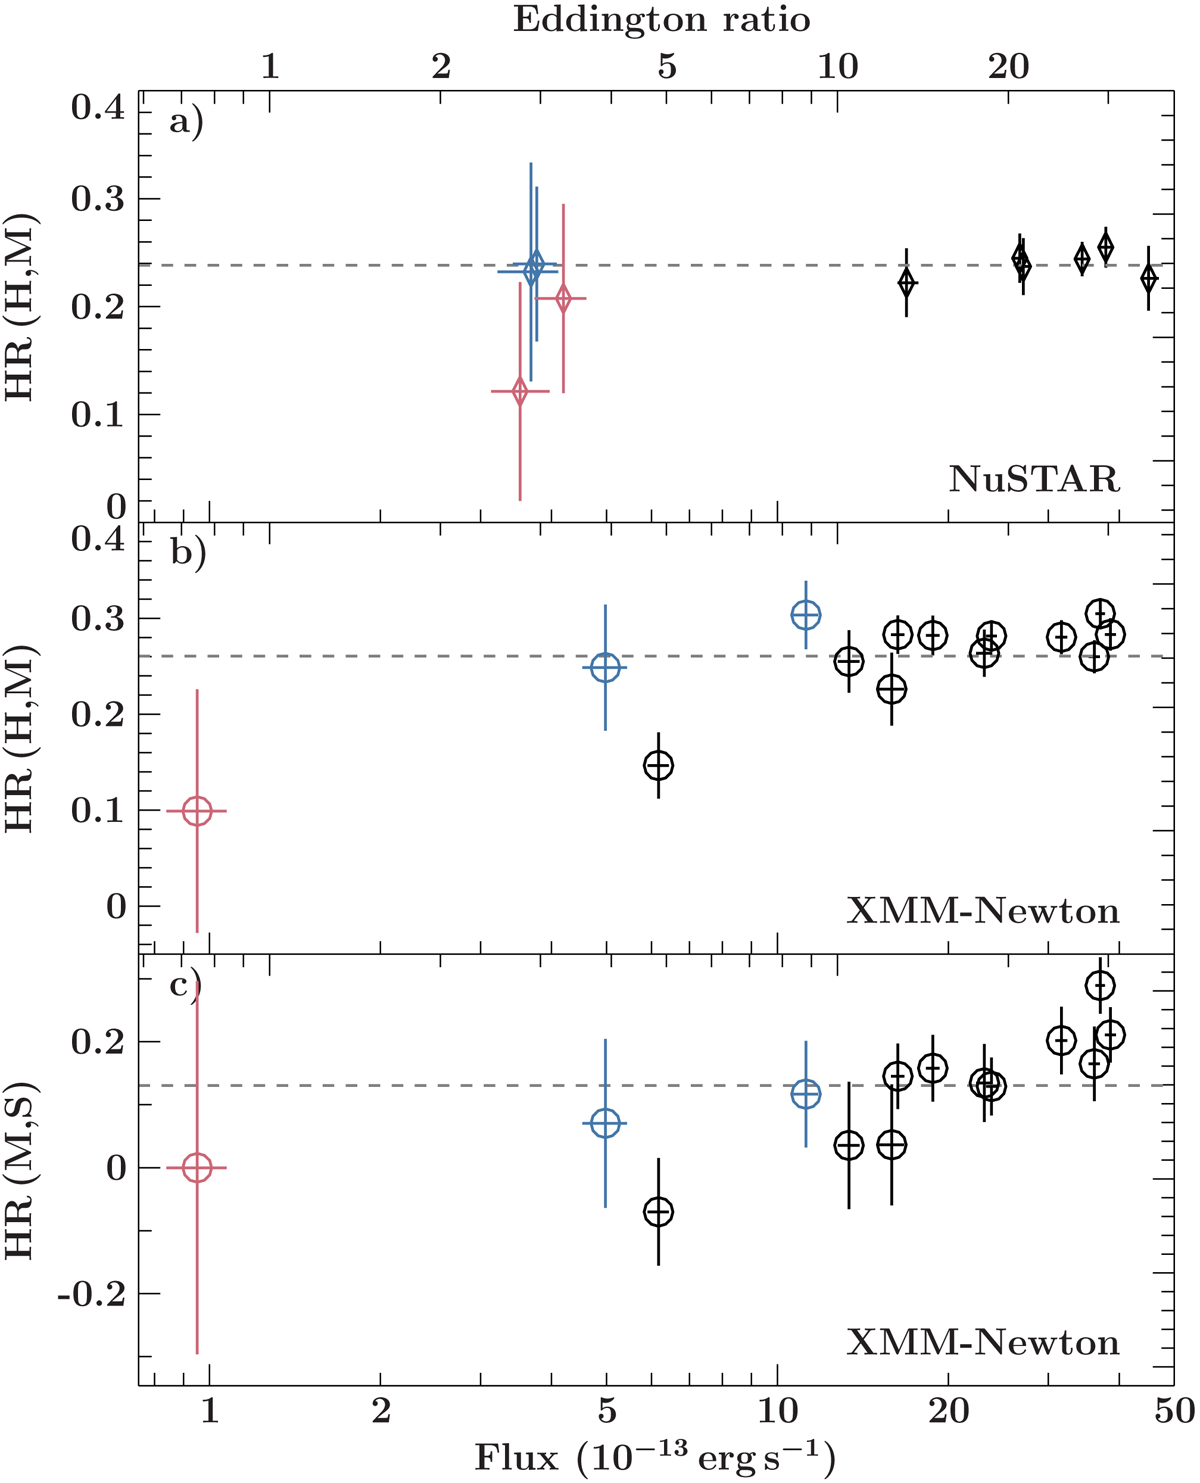
Hardness ratio as a function of flux for all XMM-Newton and NuSTAR data. a: HR between the 5.0−10.0 keV and 3.0−5.0 keV energy band for NuSTAR. b: HR between the same bands as in (a) but for XMM-Newton. c: HR between the 3.0−5.0 keV and 0.5−1.5 keV band for XMM-Newton. Data taken in 2020 are shown in red, data from 2019 in blue, and all previous data in black. The dashed lines show the respective average HR for each instrument for all data before 2019. The top y-axis gives the flux as a fraction of the Eddington limit for a 1.4 M⊙ neutron star at a distance of 3.4 Mpc.
Current usage metrics show cumulative count of Article Views (full-text article views including HTML views, PDF and ePub downloads, according to the available data) and Abstracts Views on Vision4Press platform.
Data correspond to usage on the plateform after 2015. The current usage metrics is available 48-96 hours after online publication and is updated daily on week days.
Initial download of the metrics may take a while.