Fig. 2.
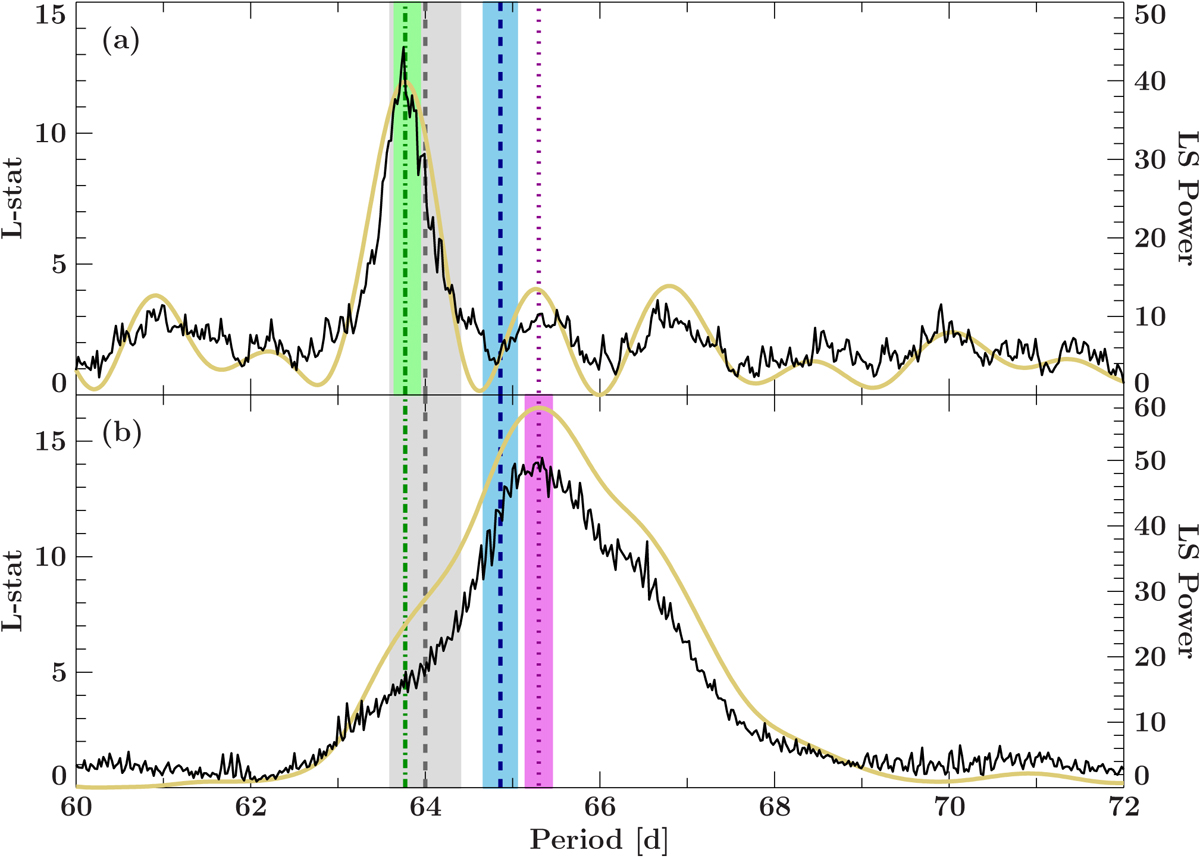
Results from epoch folding (black, left y-axis) and Lomb-Scargle periodogram (yellow, right y-axis) for the UV light curve (top) and X-ray light curve (bottom). The strongest UV period is marked by the green dotted-dashed line, the strongest X-ray period by the purple dotted line. The new orbital period is indicated by the blue dashed line, the old estimate of the orbital period is shown by the gray dashed line. The shading behind each period indicates their respective uncertainties (using the updated uncertainties for the old orbital period in gray).
Current usage metrics show cumulative count of Article Views (full-text article views including HTML views, PDF and ePub downloads, according to the available data) and Abstracts Views on Vision4Press platform.
Data correspond to usage on the plateform after 2015. The current usage metrics is available 48-96 hours after online publication and is updated daily on week days.
Initial download of the metrics may take a while.