Fig. 1.
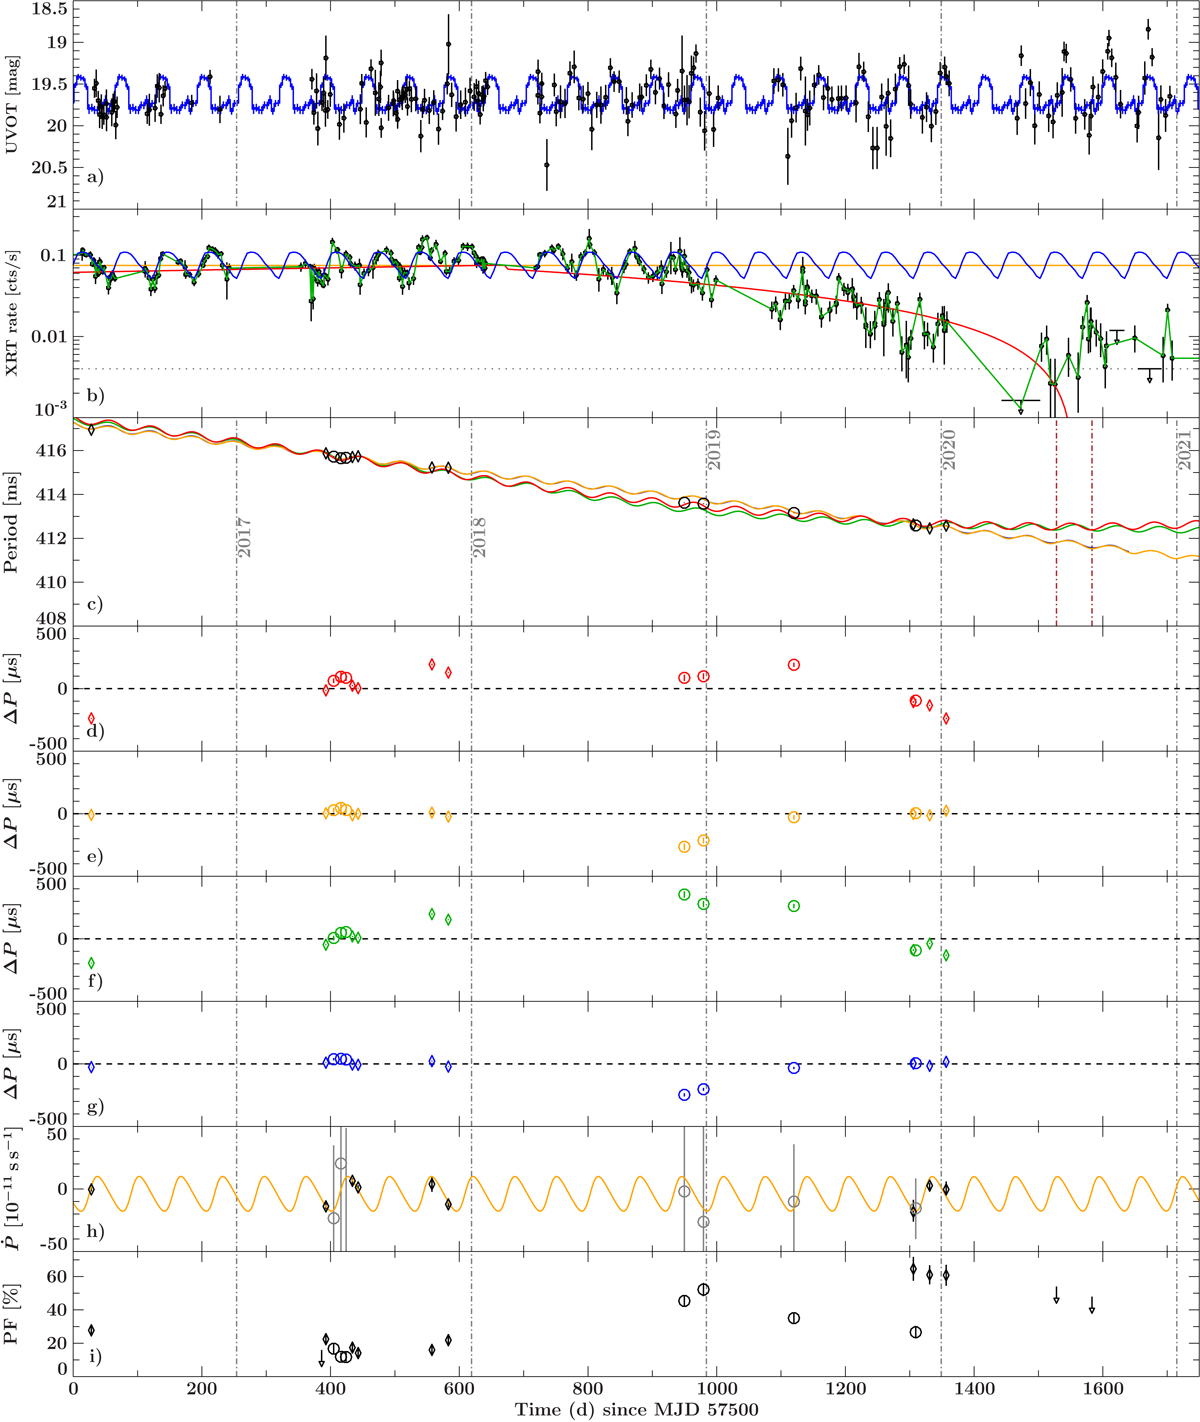
a: Swift/UVOT light curve in the U-band. b: Swift/XRT lightcurve. The colored lines show the four different assumed flux evolutions, which are used as an input for the pulse period evolution: constant flux (orange), linear brightening and dimming trend (red), measured XRT lightcurve (green), and extrapolated X-ray super-orbital period profile (blue). The dotted line represents the estimated count rate at the Eddington limit. c: pulse period evolution as measured by XMM-Newton (circles) and NuSTAR (diamonds). Superimposed are the best-fit models for the four different input lightcurves in the same colors as in panel b. The brown dotted-dashed lines indicate the times of observations when no pulsations where seen. d: residuals with respect to the linear brightening and dimming input, e: residuals with respect to a constant input, f: residuals with respect to the original lightcurve as input, and g residuals with respect to the X-ray profile input. h: measured (black and gray) and predicted (orange) pulse period derivative Ṗ. The model is based on the constant flux model. i: pulsed fraction in the 3−10 keV energy band. Upper limits are denoted by downward pointing arrows. For details see text.
Current usage metrics show cumulative count of Article Views (full-text article views including HTML views, PDF and ePub downloads, according to the available data) and Abstracts Views on Vision4Press platform.
Data correspond to usage on the plateform after 2015. The current usage metrics is available 48-96 hours after online publication and is updated daily on week days.
Initial download of the metrics may take a while.