Fig. 10
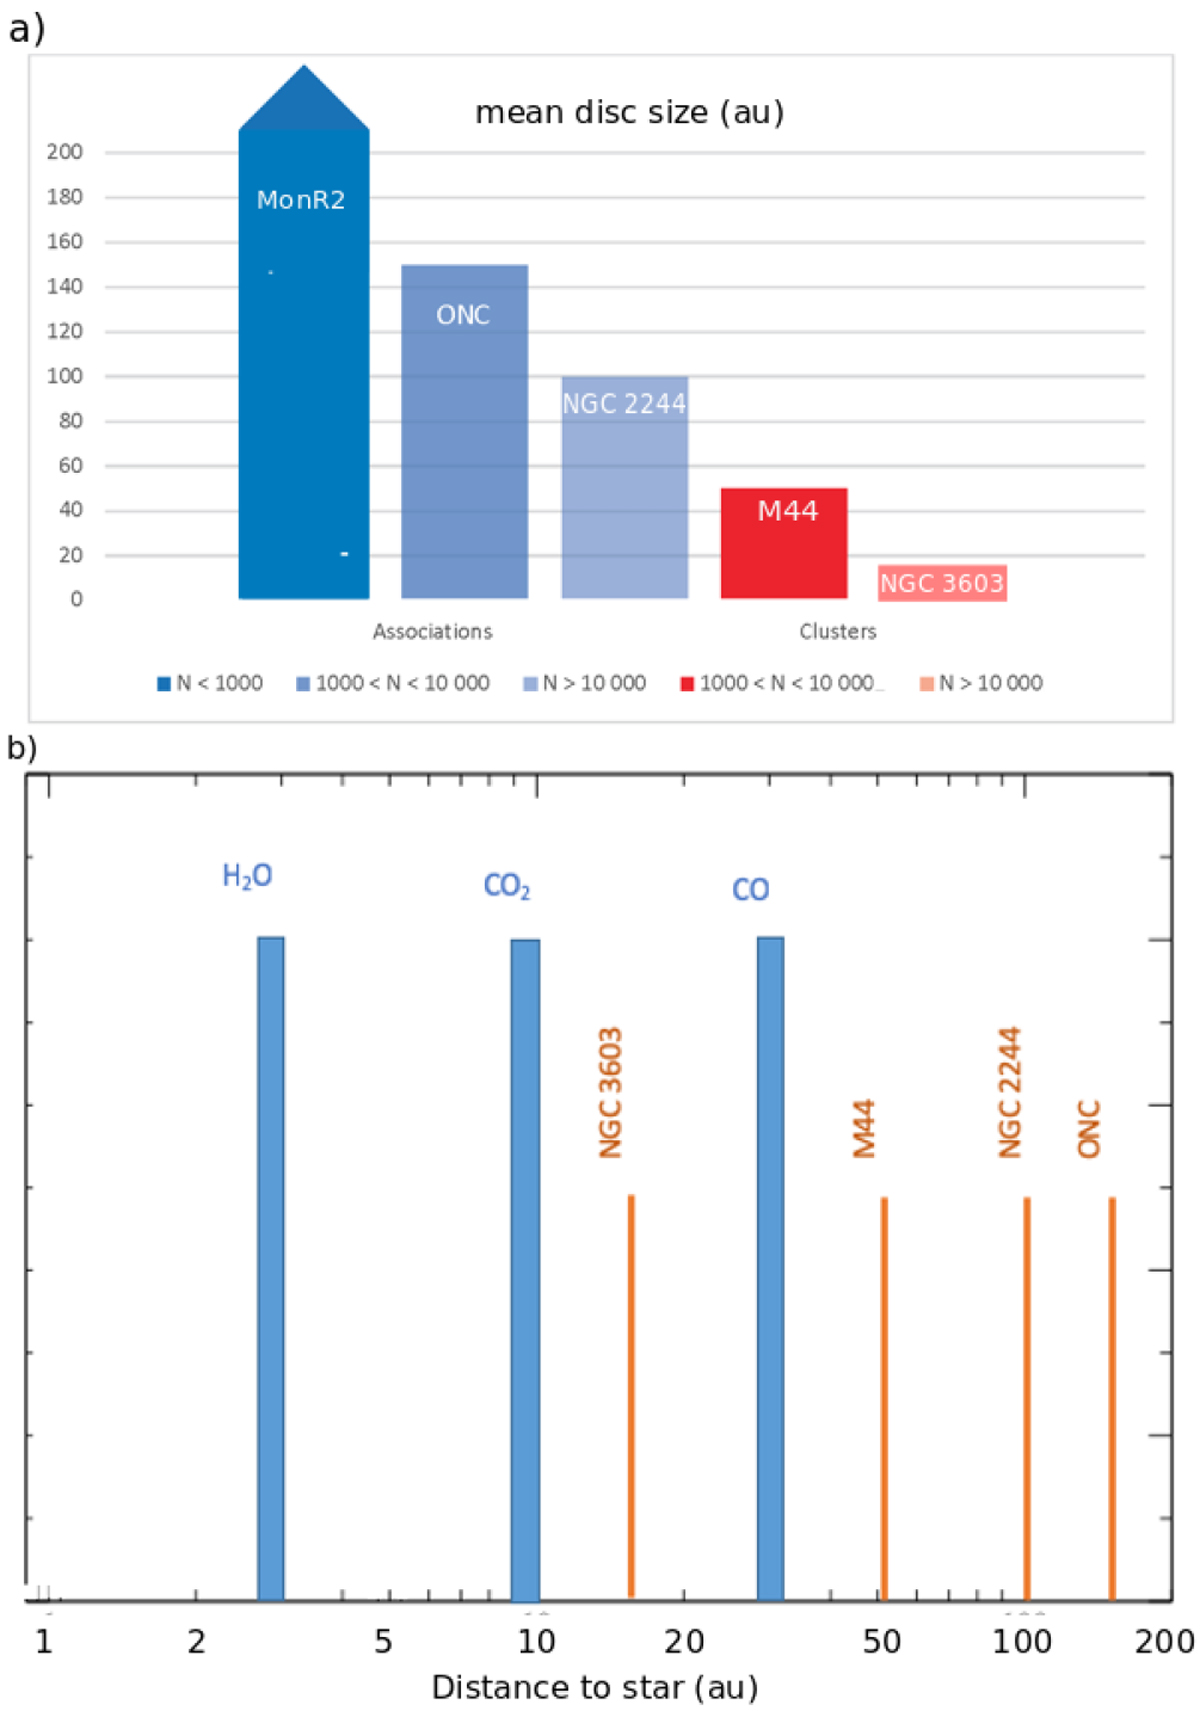
Panel a: disc truncation radii in different cluster environments. Blue bars indicate associations, red bars open clusters of different mass (adapted from Pfalzner & Bannister 2019). Panel b: comparison of the different snow lines (blue) and the mean different disc truncation radii of different cluster environments (orange) from panel a as a function of the distance to a central star.
Current usage metrics show cumulative count of Article Views (full-text article views including HTML views, PDF and ePub downloads, according to the available data) and Abstracts Views on Vision4Press platform.
Data correspond to usage on the plateform after 2015. The current usage metrics is available 48-96 hours after online publication and is updated daily on week days.
Initial download of the metrics may take a while.