Fig. 8.
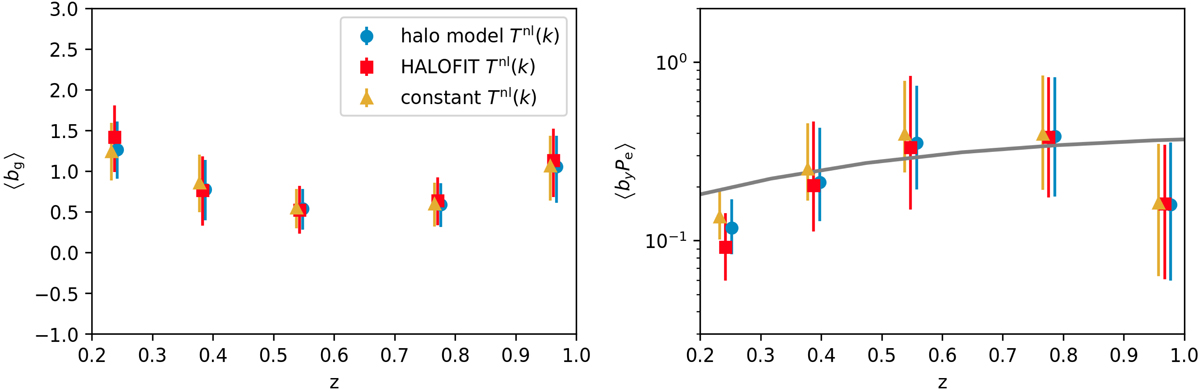
Constraints of ⟨bg⟩ and ⟨byPe⟩ in each tomographic bin. The best-fitting parameter values and errors are calculated as the modes and standard deviations of the Gaussian KDE fittings of marginalised posterior distributions. Dots with different colours are correspond to the different non-linear power spectrum models. The grey line shows the best-fit model from Chiang et al. (2020).
Current usage metrics show cumulative count of Article Views (full-text article views including HTML views, PDF and ePub downloads, according to the available data) and Abstracts Views on Vision4Press platform.
Data correspond to usage on the plateform after 2015. The current usage metrics is available 48-96 hours after online publication and is updated daily on week days.
Initial download of the metrics may take a while.