Fig. 5.
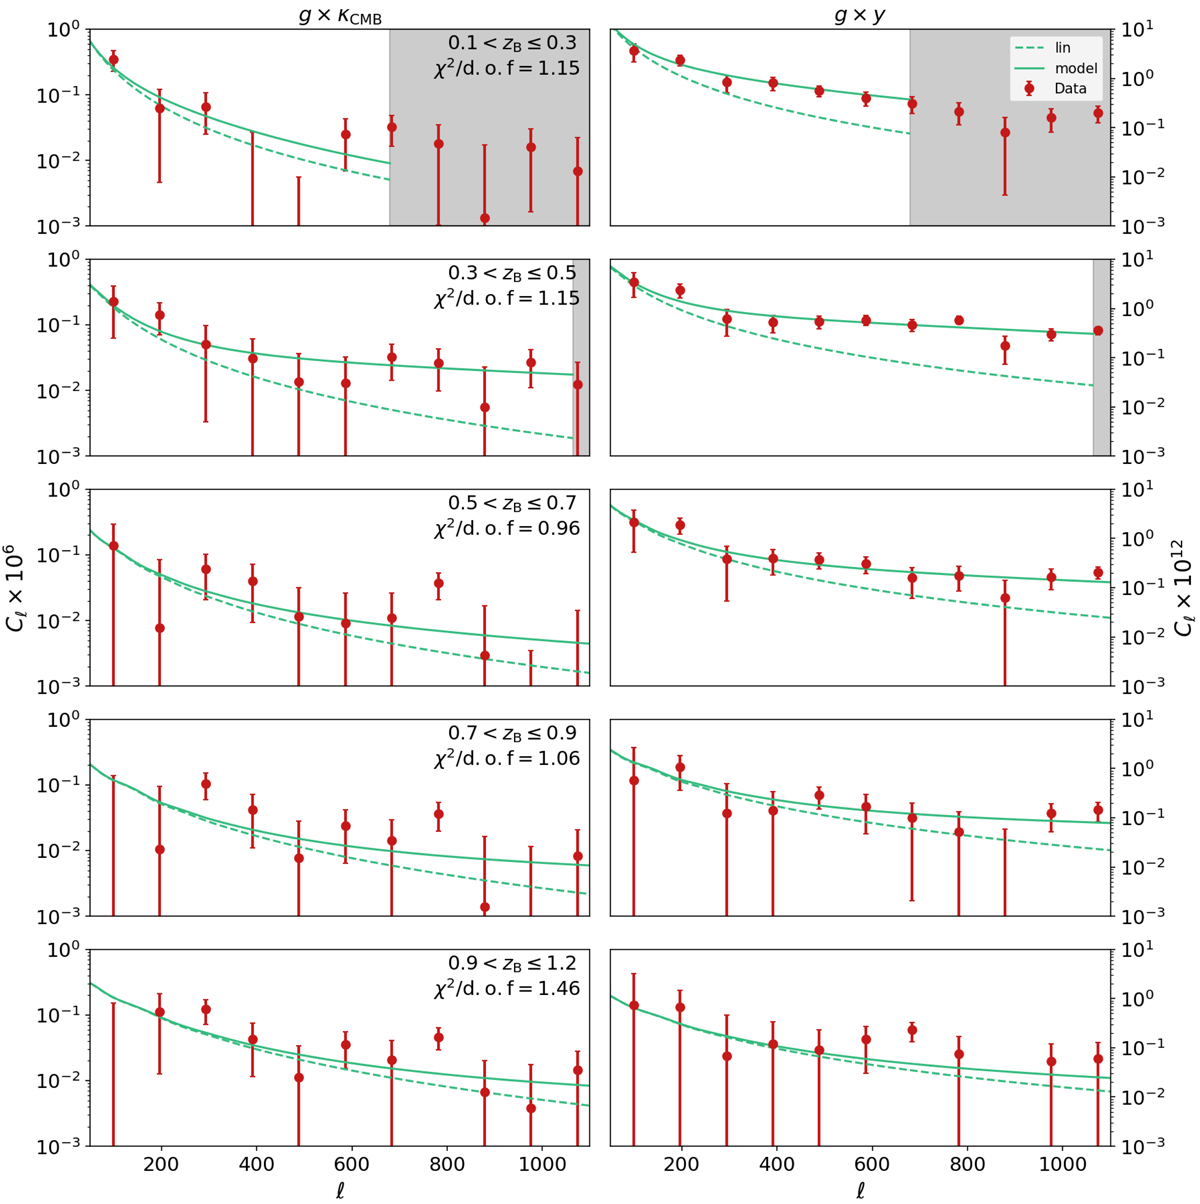
Measurements of ![]() and
and ![]() (red dots with error bars) over-plotted with best-fit models (green lines). The non-linear model shown here is the halo model non-linear template. We also plot the linear part with dashed lines. Each row shows results in each tomographic bin. Shaded regions are scales corresponding to ℓ scales within the threshold kcut > 0.7 Mpc−1, which are not included the model-fit.
(red dots with error bars) over-plotted with best-fit models (green lines). The non-linear model shown here is the halo model non-linear template. We also plot the linear part with dashed lines. Each row shows results in each tomographic bin. Shaded regions are scales corresponding to ℓ scales within the threshold kcut > 0.7 Mpc−1, which are not included the model-fit.
Current usage metrics show cumulative count of Article Views (full-text article views including HTML views, PDF and ePub downloads, according to the available data) and Abstracts Views on Vision4Press platform.
Data correspond to usage on the plateform after 2015. The current usage metrics is available 48-96 hours after online publication and is updated daily on week days.
Initial download of the metrics may take a while.