Fig. A.1
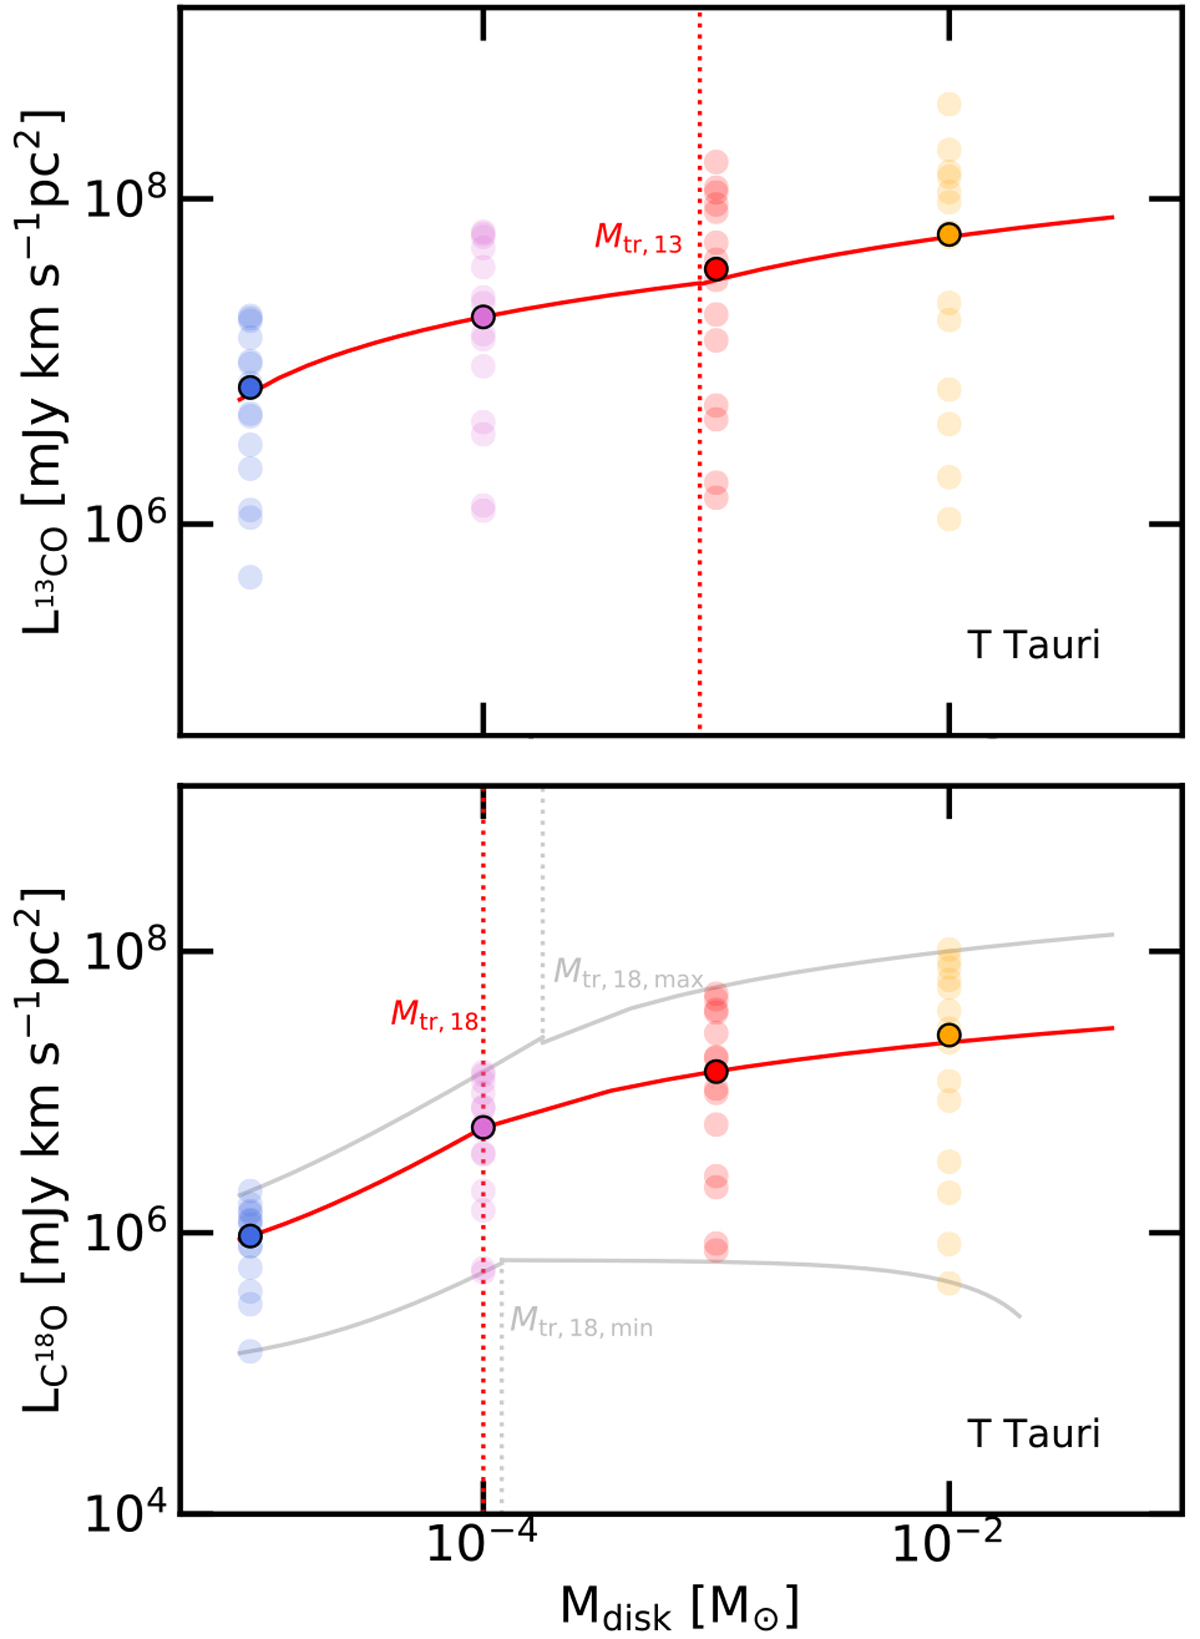
Median of the 13CO (upper panel) and C18O (lower panel) J = 2−1 line luminosities in different mass bins for compact disk models are presented with filled circles. Red solid lines show the fit functions presented in Eqs. (A.1) and (A.2). The translucent symbols show all model results, while the gray solid lines show the fit to the maximum and minimum luminosities, which can be used to estimate uncertainties on the mass measurements.
Current usage metrics show cumulative count of Article Views (full-text article views including HTML views, PDF and ePub downloads, according to the available data) and Abstracts Views on Vision4Press platform.
Data correspond to usage on the plateform after 2015. The current usage metrics is available 48-96 hours after online publication and is updated daily on week days.
Initial download of the metrics may take a while.