Fig. 1
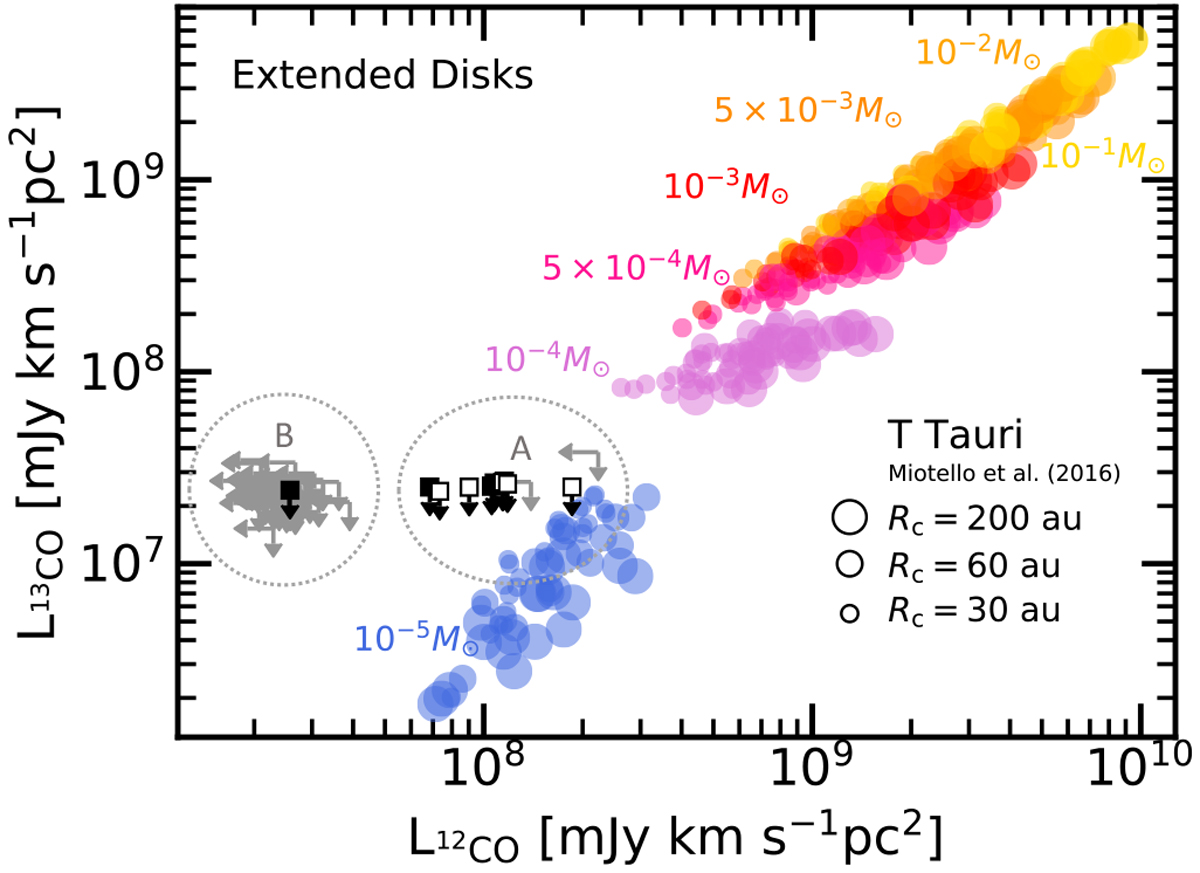
Lupus 12CO and 13CO (J = 2− 1) line luminosity are presented with black squares (empty squares if the 12CO line is partially absorbed by the cloud), where the 13CO nondetections are shown as upper limits by the black arrows and the 12CO (and 13CO) nondetections are shown as upper limits by the gray arrows. We note that the 3σ upper limits are calculated using an aperture equal to the size of the typical beam (i.e., ~ 0.21–0.25″, equivalent to~30–40 au at 160 pc; see Ansdell et al. 2018). DALI model results from Miotello et al. (2016) are shown with filled circles, color-coded by disk mass. Different symbol sizes represent different values of the critical radius Rc.
Current usage metrics show cumulative count of Article Views (full-text article views including HTML views, PDF and ePub downloads, according to the available data) and Abstracts Views on Vision4Press platform.
Data correspond to usage on the plateform after 2015. The current usage metrics is available 48-96 hours after online publication and is updated daily on week days.
Initial download of the metrics may take a while.