Fig. 3.
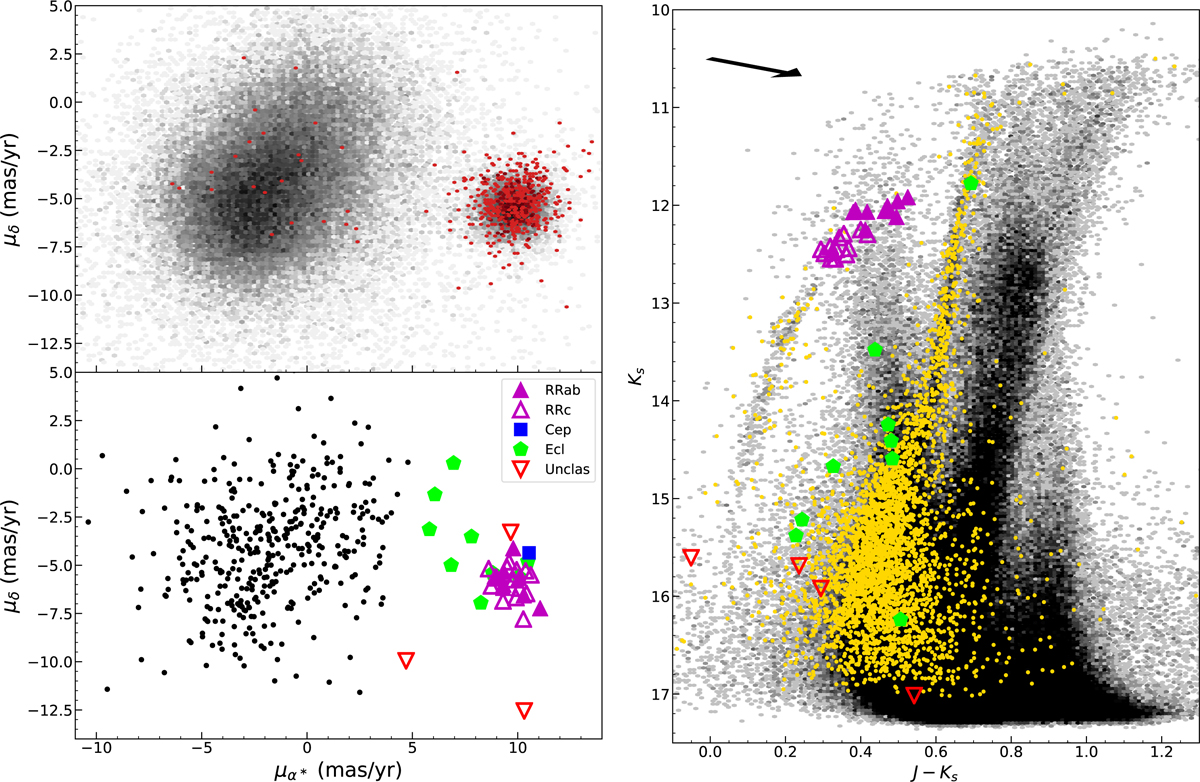
Upper left panel: PMs of the stars in the M 22 region with σ ≤ 1.0 mas yr−1. Higher transparencies represent lower densities of stars. Overplotted in red are the PMs of the stars located in the innermost regions (r ≤ 1.0′) of this GGC. Lower left panel: PMs of the detected variable stars in the field covered by M 22. Those stars selected as cluster members by our kNN classifier are shown according to their variability type: the solid magenta triangles indicate RRab stars, empty magenta triangles are RRc stars, blue squares are Cepheids, green pentagons are eclipsing binaries, and inverted red triangles are unclassified variables. Right panel: J − Ks vs. Ks near-infrared CMD of the stars in the M 22 field. Higher transparencies represent lower densities of stars. Overplotted in yellow are the stars located in the innermost regions (r ≤ 1.0′) of this GGC that were selected as candidates by our kNN classifier. The cluster member variables from the lower left panel are also overplotted. The arrow in the upper left corner shows the selected reddening vector.
Current usage metrics show cumulative count of Article Views (full-text article views including HTML views, PDF and ePub downloads, according to the available data) and Abstracts Views on Vision4Press platform.
Data correspond to usage on the plateform after 2015. The current usage metrics is available 48-96 hours after online publication and is updated daily on week days.
Initial download of the metrics may take a while.