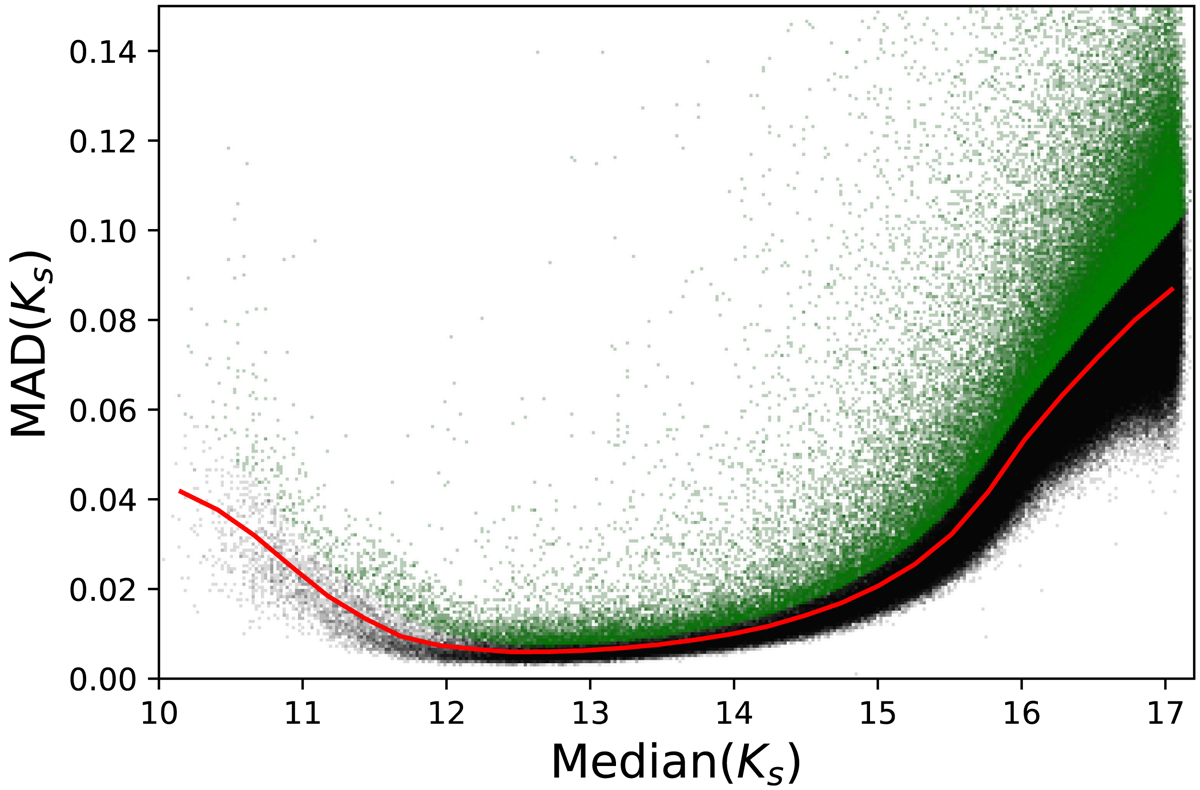
Fig. 1.

MAD vs. median of the Ks magnitudes for the different epochs with VVV detections for the stars in M 22, serving as an example of the preliminary selection to detect variable candidates. The green dots show the stars we keep for the next step of the analysis. They are located 1σ above the median of the distribution, shown by the red line.
Current usage metrics show cumulative count of Article Views (full-text article views including HTML views, PDF and ePub downloads, according to the available data) and Abstracts Views on Vision4Press platform.
Data correspond to usage on the plateform after 2015. The current usage metrics is available 48-96 hours after online publication and is updated daily on week days.
Initial download of the metrics may take a while.


