Fig. C.1
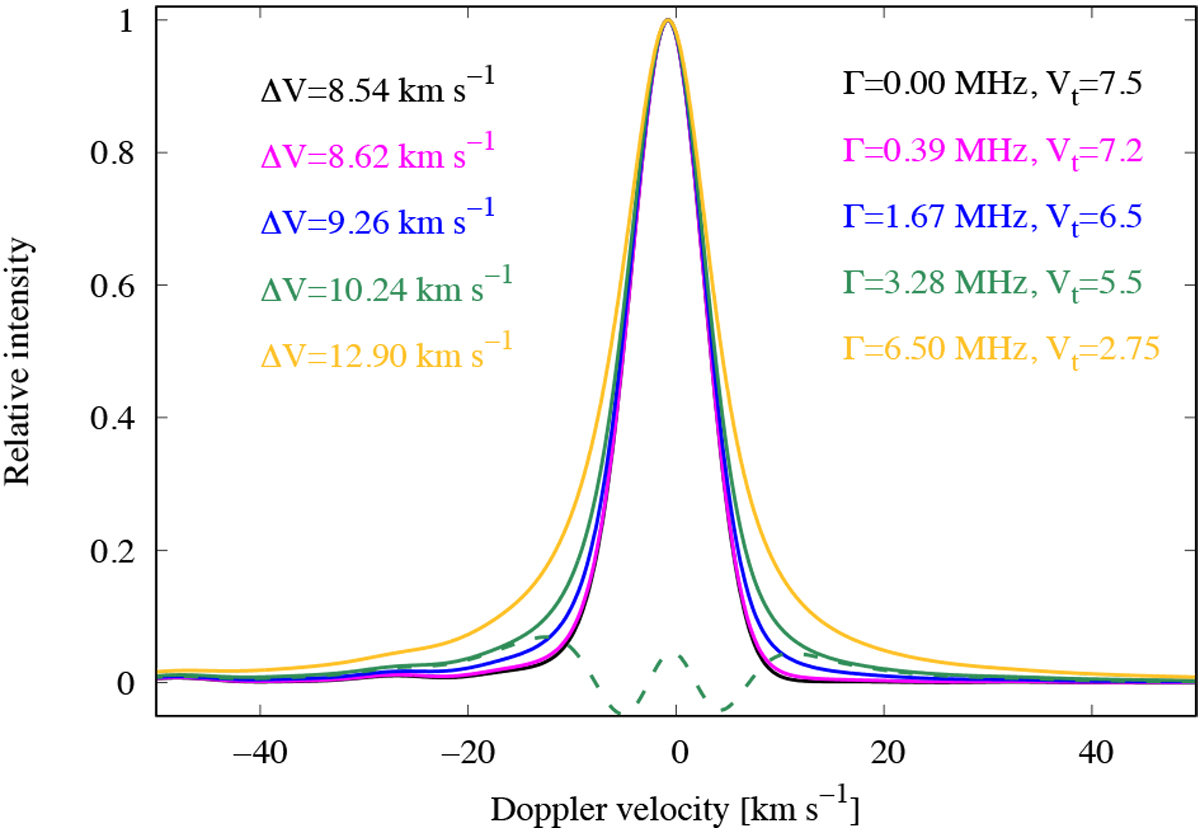
Series of model profiles of the 30α line for different values of the Lorentzian width Γ and turbulent widths that give Δυ = 8.5 km s−1 in the 26α line. The fitted Gaussian widths are indicated: they exceed the observed width when Γ > 1.7 MHz. The deviation from a single Gaussian is shown for the nominal case as a dashed green curve.
Current usage metrics show cumulative count of Article Views (full-text article views including HTML views, PDF and ePub downloads, according to the available data) and Abstracts Views on Vision4Press platform.
Data correspond to usage on the plateform after 2015. The current usage metrics is available 48-96 hours after online publication and is updated daily on week days.
Initial download of the metrics may take a while.