Fig. 3
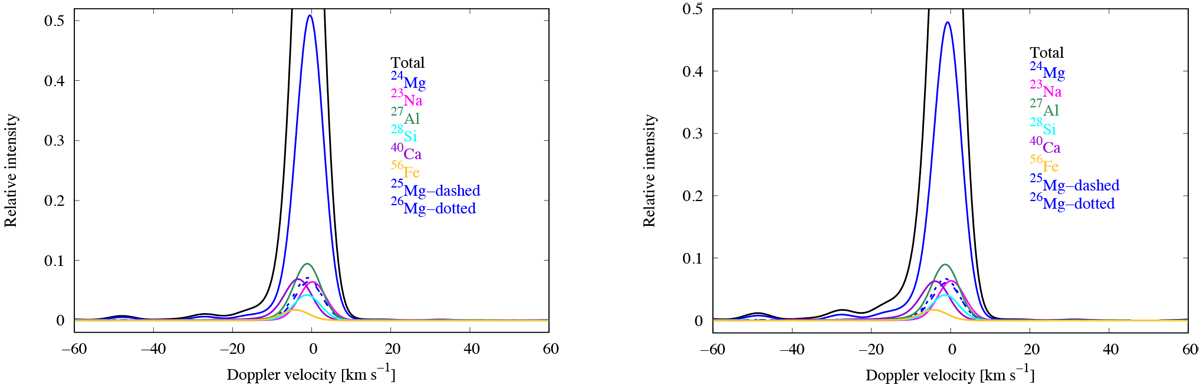
Computed model profiles of the 30α (left) and 26α (right) transitions, excluding collisional broadening and radiative damping, are shown in black (truncated at a value of0.5, the peak value is 1.0). The blended profiles of the eight atoms and isotopes are shown in colours to illustrate their relative contributions and the mass-shifts in frequency. All of the profiles are slightly asymmetrical owing to the fine structure as described in Appendix C. A turbulent velocity Δυturb = 7.5 km s−1 is adopted so that the fitted FWHMs of the model profiles match the observed width, 8.5 km s−1.
Current usage metrics show cumulative count of Article Views (full-text article views including HTML views, PDF and ePub downloads, according to the available data) and Abstracts Views on Vision4Press platform.
Data correspond to usage on the plateform after 2015. The current usage metrics is available 48-96 hours after online publication and is updated daily on week days.
Initial download of the metrics may take a while.