Fig. 2
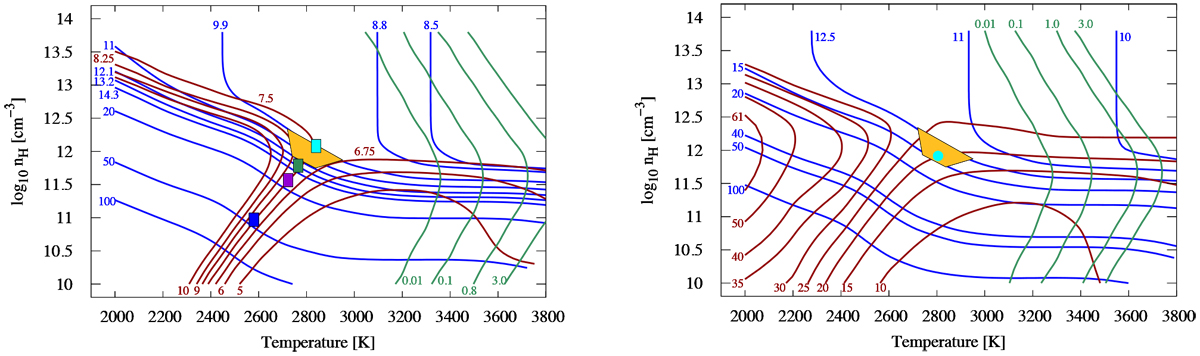
Left: LTE solutions with ρ = 0.1 that yield a line flux density of 7.3 mJy in the 30α blend for solar abundances. Blue contours display equal values of the angular diameter θ in mas. Dark red contours show the 232 GHz continuum flux density in mJy. Green contours show the flux density of the corresponding hydrogen line in mJy. The polygon covers the space of primary solutions that allow for ±10% changes on the continuum flux density and the angular diameter for illustrative purposes. The shaded rectangles indicate how the primary solution shifts when the value of ρ is changed by a factor of two (0.05 (cyan) and 0.20 (green)), and when a source size of 17 mas and ρ = 0.1 (violet) and 2 (blue) are adopted. Right: same as left panel but for the 26α blend and a line flux density of 25 mJy, and the 354 GHz continuum flux density in mJy. The cyan solid circle indicates the location of the reference model.
Current usage metrics show cumulative count of Article Views (full-text article views including HTML views, PDF and ePub downloads, according to the available data) and Abstracts Views on Vision4Press platform.
Data correspond to usage on the plateform after 2015. The current usage metrics is available 48-96 hours after online publication and is updated daily on week days.
Initial download of the metrics may take a while.