Fig. 6.
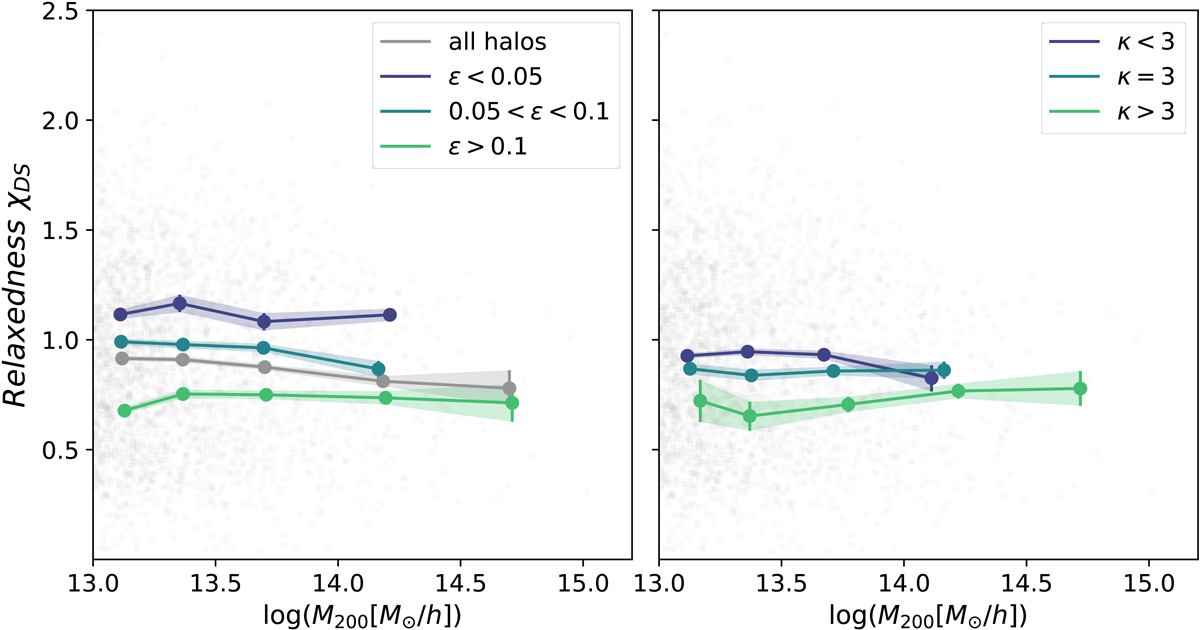
Mean relaxedness (computed with Eq. (1)) as a function of mass. Right panel: mean relaxedness for three different ellipticity bins: almost spherical (ϵ < 0.05), quite elliptical (0.05 < ϵ < 0.1), and elliptical (ϵ > 0.1). The gray line traces the mean relaxedness for all groups and clusters, regardless of their ellipticity. Left panel: mean relaxedness for four different connectivity bins: κ = 1, κ = 2, κ = 3, and κ > 3. The error bars are the errors on the mean, derived from bootstrap resampling.
Current usage metrics show cumulative count of Article Views (full-text article views including HTML views, PDF and ePub downloads, according to the available data) and Abstracts Views on Vision4Press platform.
Data correspond to usage on the plateform after 2015. The current usage metrics is available 48-96 hours after online publication and is updated daily on week days.
Initial download of the metrics may take a while.