Open Access
Fig. 2.
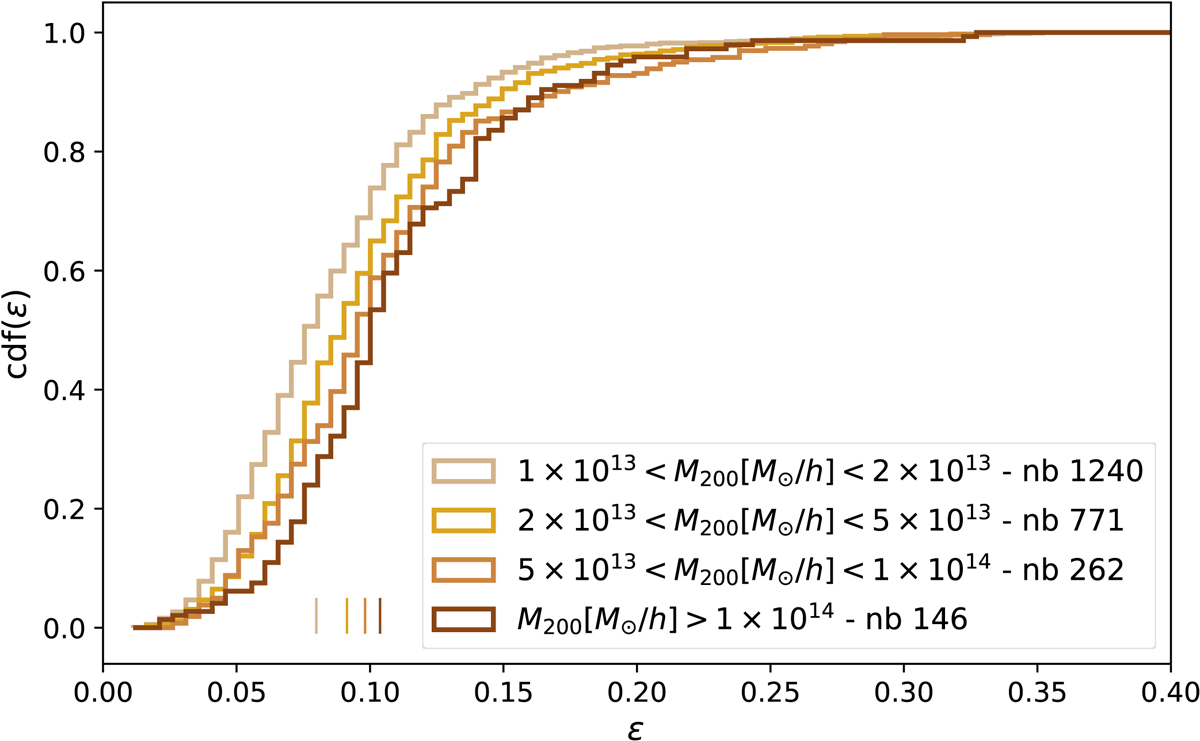
Ellipticity cumulative distribution for four different mass bins of groups and clusters at z = 0. The short vertical lines at the bottom show the ellipticity median value for each mass bin. The number of groups and clusters per mass bin is written in the box.
Current usage metrics show cumulative count of Article Views (full-text article views including HTML views, PDF and ePub downloads, according to the available data) and Abstracts Views on Vision4Press platform.
Data correspond to usage on the plateform after 2015. The current usage metrics is available 48-96 hours after online publication and is updated daily on week days.
Initial download of the metrics may take a while.