Open Access
Fig. 11.
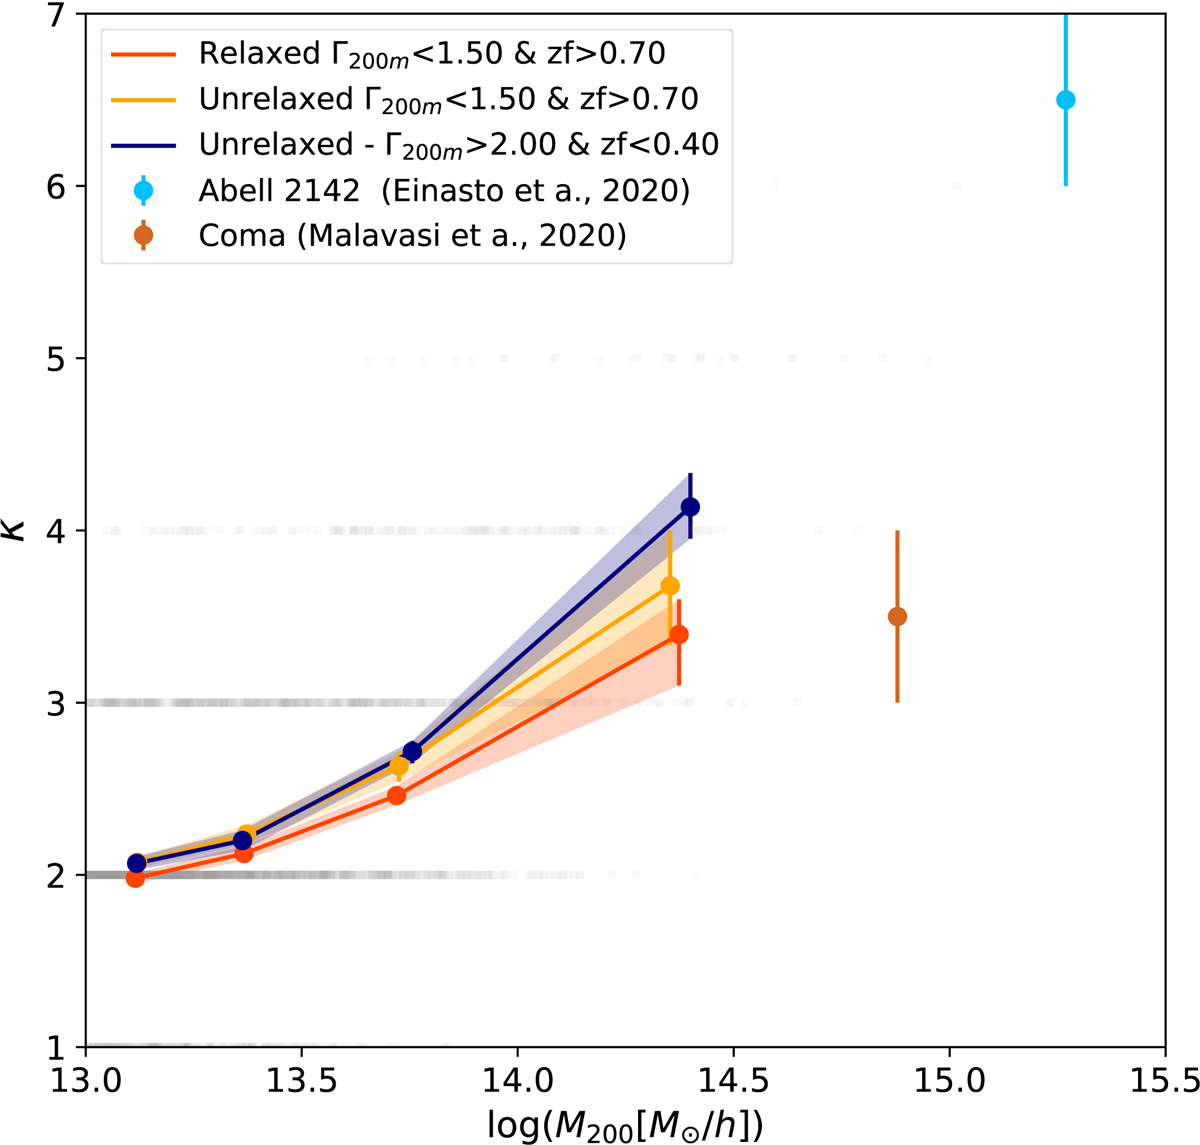
Mean connectivity as a function of the two main populations in MAH and dynamical state, as discussed in Sect. 4.3. The two observational measurements of A2142 and the Coma cluster are shown in cyan and brown, respectively.
Current usage metrics show cumulative count of Article Views (full-text article views including HTML views, PDF and ePub downloads, according to the available data) and Abstracts Views on Vision4Press platform.
Data correspond to usage on the plateform after 2015. The current usage metrics is available 48-96 hours after online publication and is updated daily on week days.
Initial download of the metrics may take a while.